Beware - UK inflation may damage your long-term wealth!

In this month’s Investment Market update we will first cover the UK’s most recent Consumer Price Index (CPI) inflation figures and look at the underlying drivers that are likely to keep inflation and interest rates higher for longer. We’ll then move on to the benefits of long-term investing over cash accounts, and how long-term investing can help to counteract the negative effects of inflation on your wealth.
UK Inflation
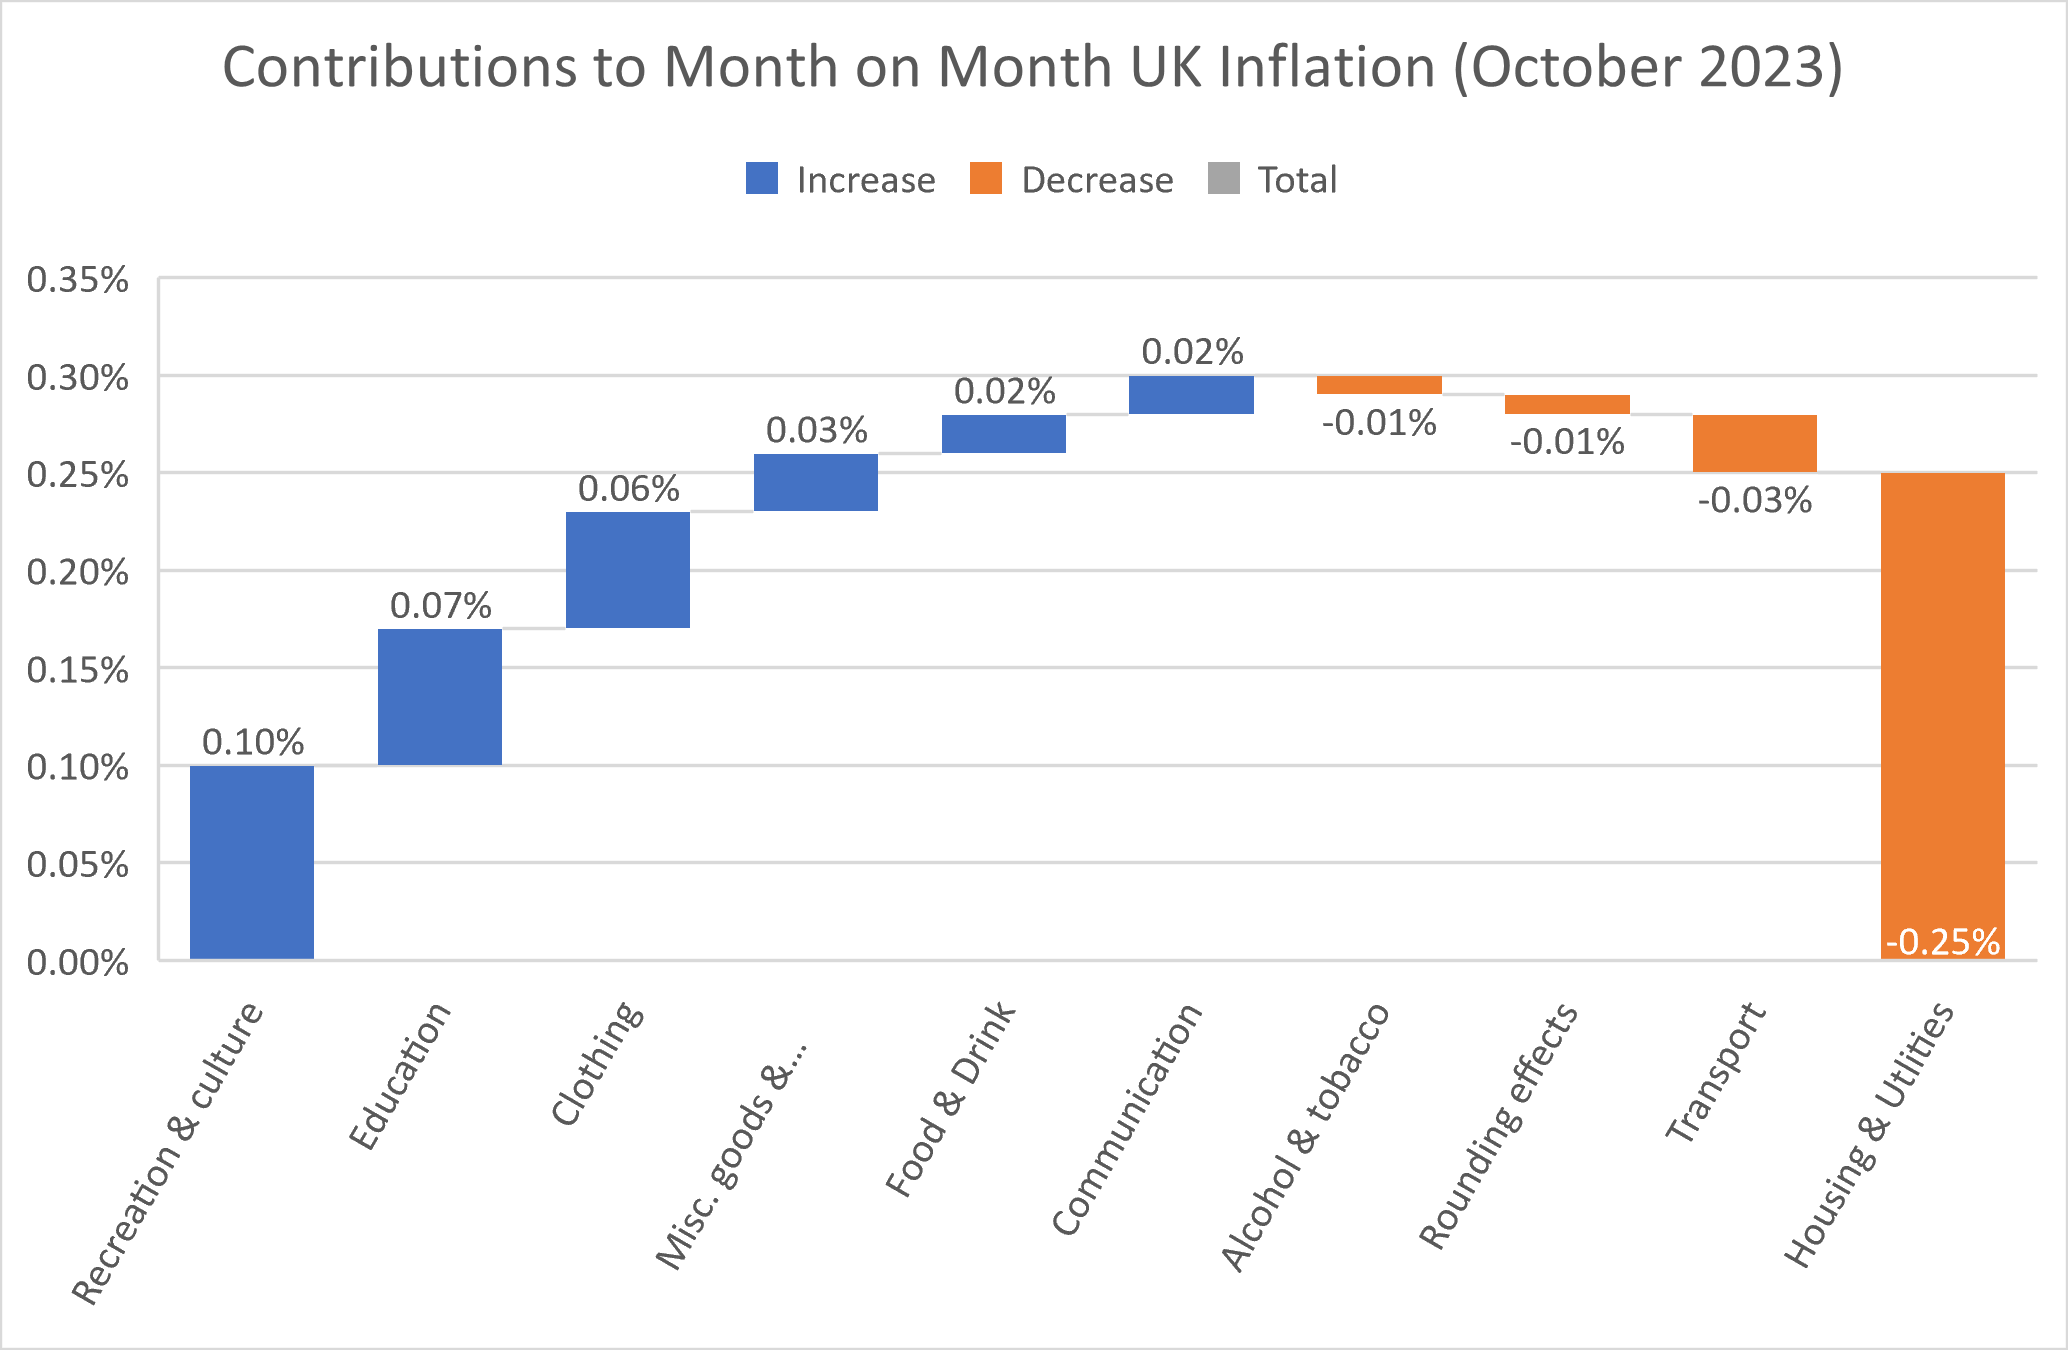
In October year-on-year inflation (i.e. from October 2022 to October 2023) came in at 4.6%, a decline from the 6.7% figure in September. A large driver of that drop was the fact that month-on-month inflation (i.e. from September 2023 to October 2023) was flat at 0%. This is encouraging news at first sight, however when we break down the contributions to this 0% figure, we see that much of this is due to the reduction in the energy bill price cap implemented by the government.

Figure 1. Contributions to October 2023 Month-on-Month UK Inflation, Source: ONS, 2023
The waterfall chart above has categories of goods and services on the horizontal axis, with each bar representing how much that category changed to the overall level of inflation from the previous month with the bars adding up to get to the final level of month-on-month inflation in October (0%). Blue bars show categories that added and orange bars show categories that subtracted. What stands out is the large positive contributions to inflation of wage-sensitive services like recreation & culture, and education. Furthermore, the bulk of the negative inflationary effects were from housing & utilities, which is the category including the energy bills that the government's price cap reduced. We can therefore conclude that the ‘underlying’ inflation rate remains high, even though regulatory effects on energy have pulled the figures down for now.
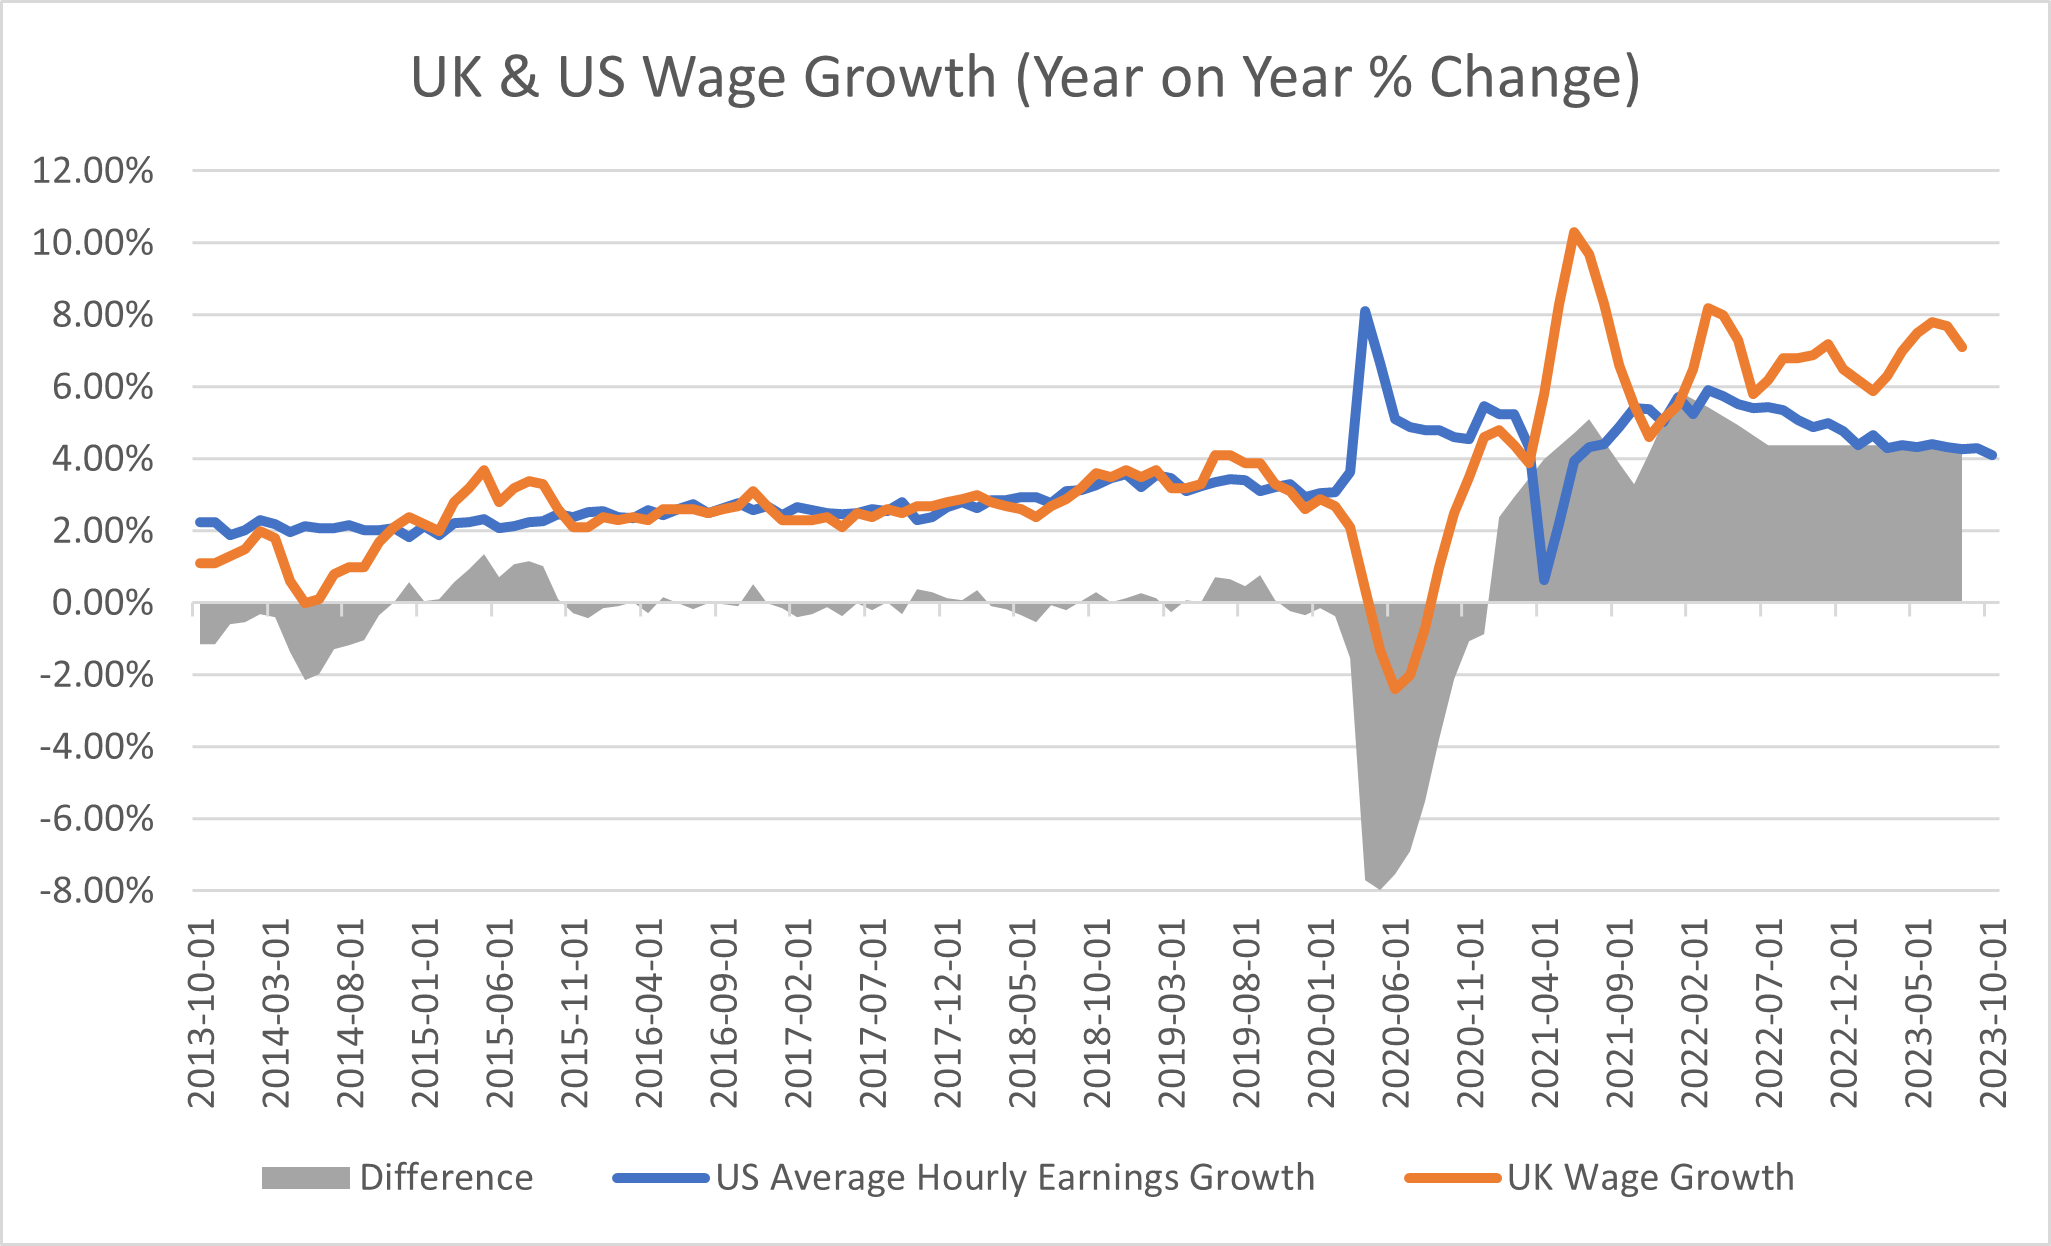
To get a sense of why the underlying inflation rate in the UK remains high, it helps to compare wage growth in the UK to a developed market peer – in this case the US.

Figure 2. Year on Year % Change in UK & US Wage Growth, Source: ONS, BLS, 2023
It is striking how UK wage growth has remained consistently above the US for the entire post-pandemic period. This is largely a result of a deeper skills mismatch between what workers have to offer and employers desire, leading employers to bid up the wages of those with the desired skills. Bank of England (BoE) research shows that there are signs of this issue becoming less acute, however it is still likely to remain worse than the pre-pandemic period, and therefore inflation is likely to remain above the Bank of England 2% target for longer than expected.

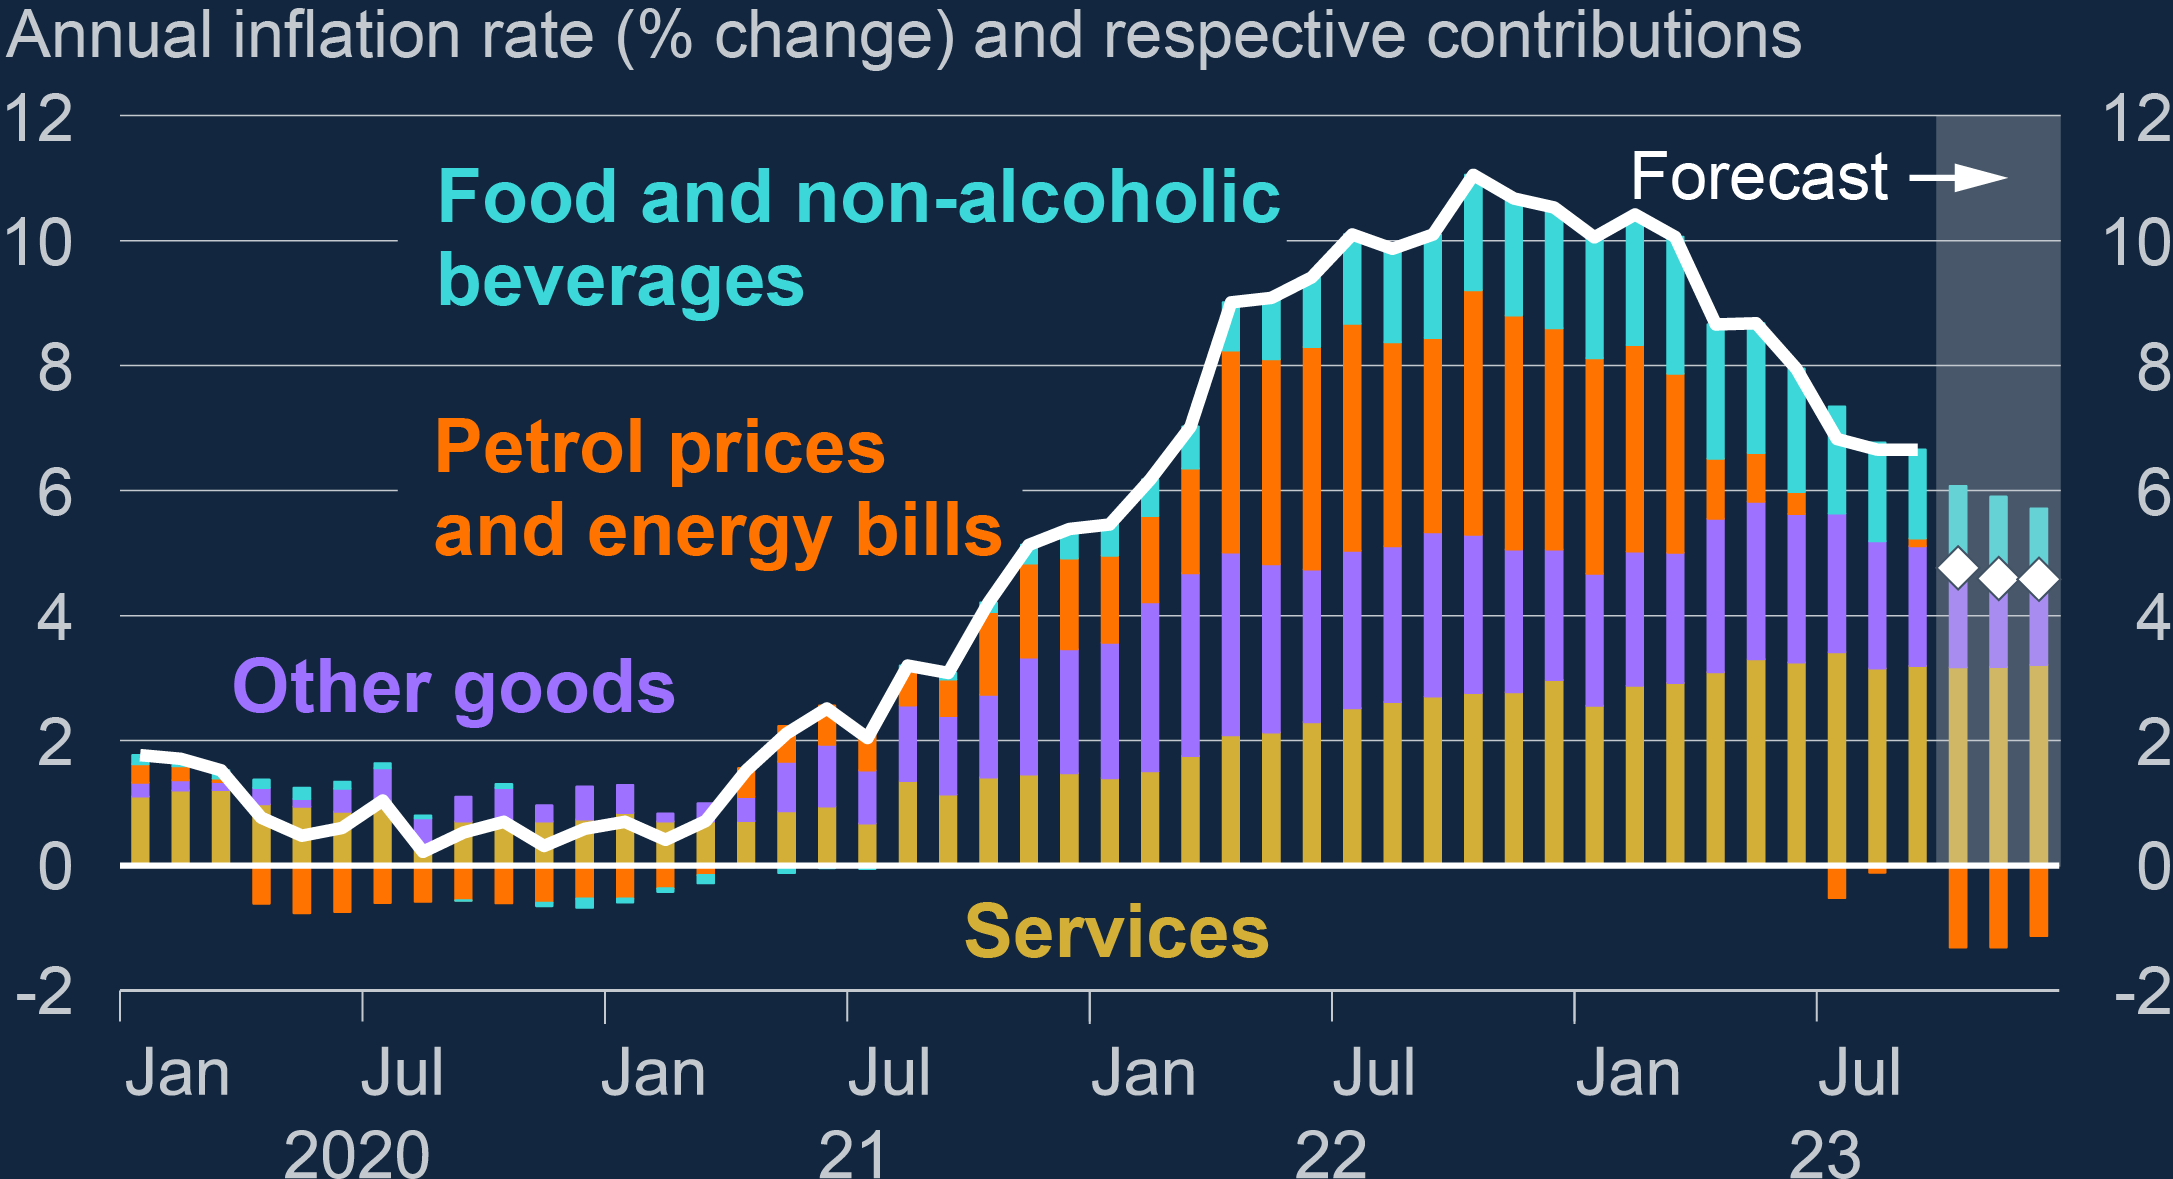
Figure 3. UK CPI Category Breakdown & Projection, Source: Bank of England (BoE), 2023
This chart from the Bank of England decomposes inflation into broad categories and shows their projections into 2024. The good news is that inflation seems set to fall, however the worrying aspect is the stubbornness of the ‘Services’ inflation, itself alone above the 2% target. Services inflation is largely driven by wage gains as labour tends to be a larger share of the cost input to a services business, meaning stubbornly high wage gains will translate into persistent services driven inflation.
This will also mean that UK interest rates are likely to stay higher for longer than developed market peers, as the Bank of England has less leeway to cut interest rates in response to stumbling economic growth. This will make UK assets less attractive on a relative basis when compared with US and European assets, as interest rate cuts tend to fuel a rally in bond and equity markets. That being said, UK equities in particular are starting at lower valuations and so can be seen as more attractive on those grounds, meaning there will be a toss-up for investors between choosing cheaper UK assets versus foreign assets with more interest-rate cut driven growth potential. It will therefore pay to remain diversified between regions, avoiding putting all your eggs in one basket.
Investing for the long-term to beat inflation
So, how can you beat inflation over the long term? Even though the last two years have been rough, with inflation regularly above the yields available in cash accounts and many major classes of risk-assets either undershooting inflation or delivering negative returns, a long-term approach can help to shield against the erosion of wealth to inflation.
JP Morgan forecast a 7.1% annual return from global equities (as measured by the MSCI World index of equities) through the next 10-15 years, while the Bank of England forecast the yields on cash accounts to be the following going forward:
| Year 1 | Year 2 | Year 3 | Year 4 | Year 5 | |
|---|---|---|---|---|---|
| Cash | 5.30% | 5.1% | 4.5% | 4.2% | 2.8% |
Figure 4. Projected Cash Rates, Source: Bank of England (BOE), 2023
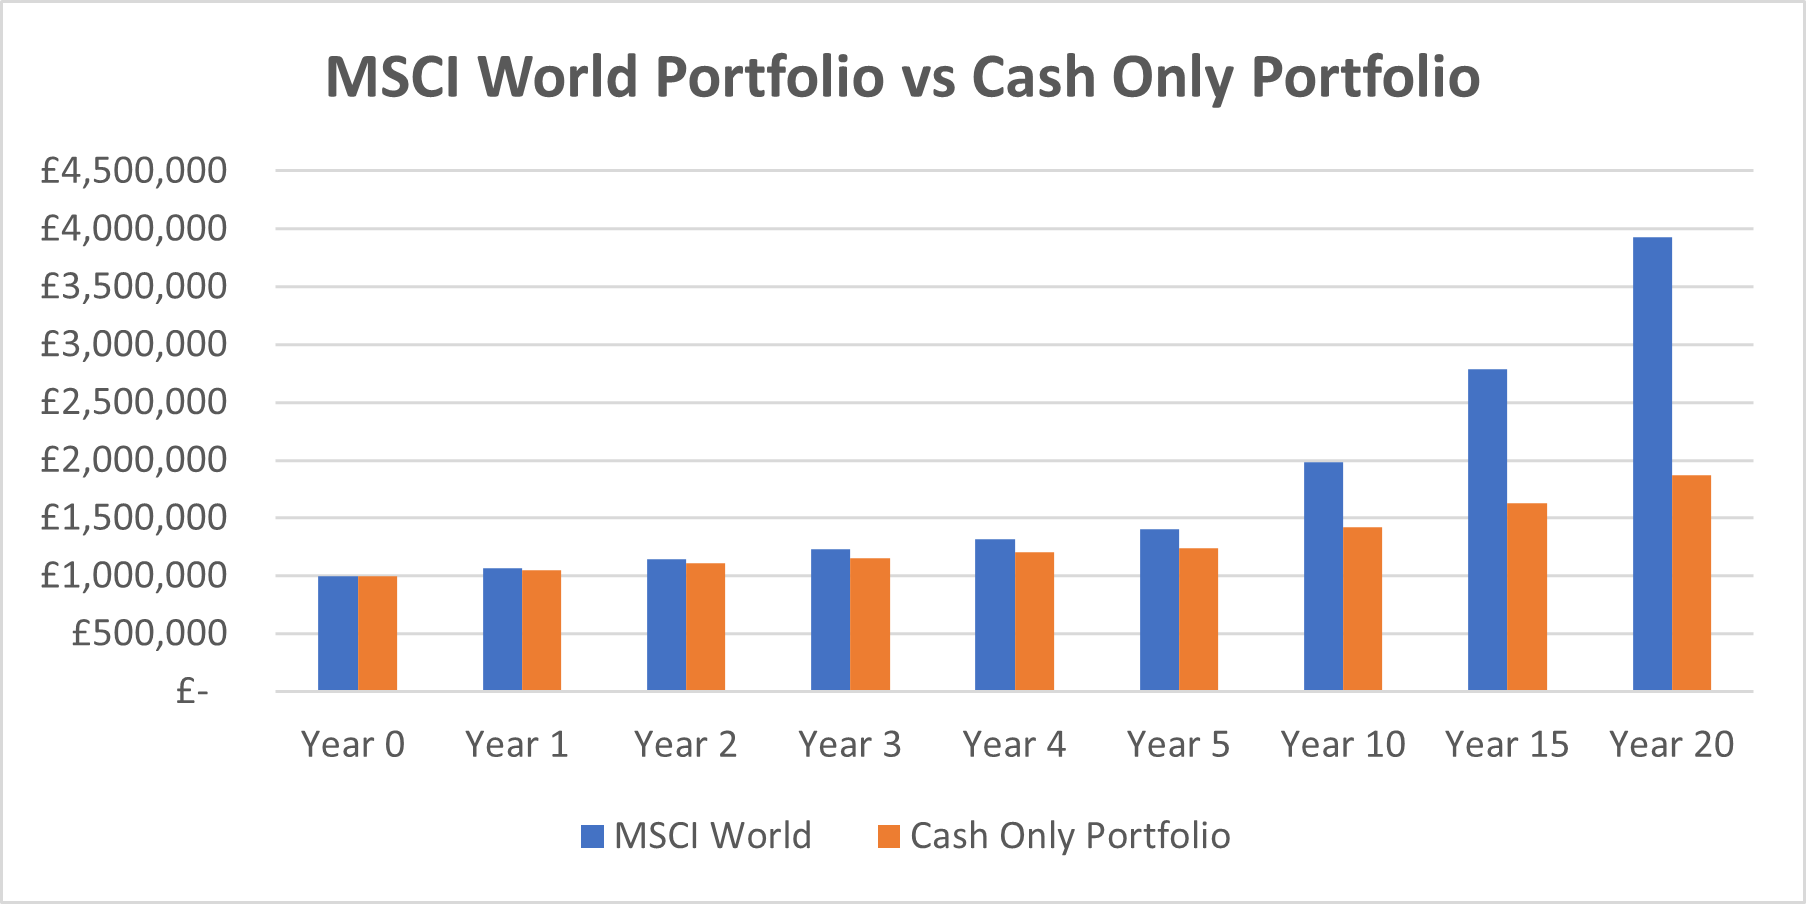
When we run these projections forward, we start to see the benefits of investing for the long term. The graph below shows the cumulative returns from a £1m investment in a cash account versus an investment in a portfolio of equities, all the way up to a 20-year time horizon.

Figure 5. Comparison of projected cumulative returns to cash & global equities, (Source: BoE, JP Morgan), 2023
Over the very short term, the difference between cash and equities seems marginal so one might question the benefits of taking the increased risk of equities. However, over the long-term the compounded effects of higher expected equity returns really start to shine – compounding refers to the effect of higher growth rates, meaning that growth is applied to a larger number as time goes by, making growth exponential. By year 20 there is a 205.3% difference in the two investment strategies!
As ever short term financial planning needs will continue to be met by cash but long term success will be achieved by exposure to equities. “Time in” the markets will enhance your future wealth rather than “timing” entry to the markets!
There is also the question of beating inflation. Surveyed firms and households expect medium-term inflation to settle around 3%, while financial markets are expecting inflation of around 4% over the medium-term. This is a step-up from the 2-3% of the pre-pandemic decade, however the 7.1% projected return from global equities more than compensates for this and can allow for real terms (i.e. inflation adjusted) growth in wealth. The key, however, is staying invested over the long term so that the effects of compounding can work to your advantage and the short-term volatility of markets is smoothed out.
So, what does this mean for me?
More stubborn inflation will mean that the Bank of England has less leeway to cut interest rates going forward, even if economic growth starts to stumble, meaning interest rates in the UK stay higher for longer – than other developed economies around the world. This will make UK assets less attractive on a relative basis when compared with US and European assets, as interest rate cuts tend to fuel a rally in bond and equity markets. That being said, UK equities in particular are starting at lower valuations and so can be seen as more attractive on those grounds, meaning there will be a toss-up for investors between choosing cheaper UK assets versus foreign assets with more interest rate cut driven growth potential.
In conclusion therefore, it will therefore pay to remain invested for the long-term in a diversified portfolio with exposure to both UK and foreign assets that can beat inflation over the long-term.
Note: This Market update is for general information only, does not constitute individual advice and should not be used to inform financial decisions. Additionally, past performance is not a guide to future returns. Investment returns are not guaranteed, and you may get back less than you originally invested.
- Terms & Conditions
- Privacy Policy
- Key Investor Information
- Complaints
- About us
- Our fees
- FAQs
- Contact us
- Sitemap
- The Private Office
- Savings Champion
As with all investing, your money is at risk. The value of your investments can go down as well as up and you could get back less than you put in. Read more information about risk here. The tax treatment of your investment will depend on your individual circumstances and may change in the future. You should seek financial advice if you are unsure about investing.
Investment Champion Online Limited is an Appointed Representative of The Private Office Limited, which is authorised and regulated by the FCA. Both companies are registered in England and Wales with a registered office at 2 The Bourse, Leeds LS1 5DE. Dealing and custody services are provided by Hubwise Securities Limited which is authorised and regulated by the Financial Conduct Authority FRN: 502619.
Copyright