Diversify or die - the case for balanced investor portfolios

In our Investment Markets update this month, we’re going to cover the following 2 themes:
- How April 2024 contrasted to Q1, leading to the benefits of diversification.
- The impact of the change in monetary policy expectations in April and how this drove returns.
Market Volatility and Investor Sentiment
Markets are fickle and are prone to reversing their trends at the drop of a hat. The fundamental forces that underpin them are usually slow moving, but investors animal spirits aren’t easily tamed. They can bolt like a wild beast in response to small disturbances, in the form of economic data releases that don’t conform to expectations. This was the case in April, when markets took slowing US economic growth and sticky inflation data poorly, causing a stampede to exit many of the main regional equity and fixed income markets. That said, there were some regions that maintained their sense of calm and even excelled – reinforcing the value of holding a portfolio diversified across geographies.
Q1 Market Performance
To frame this story we’d like to show you how markets behaved from January to March. The table below provides a brief summary.
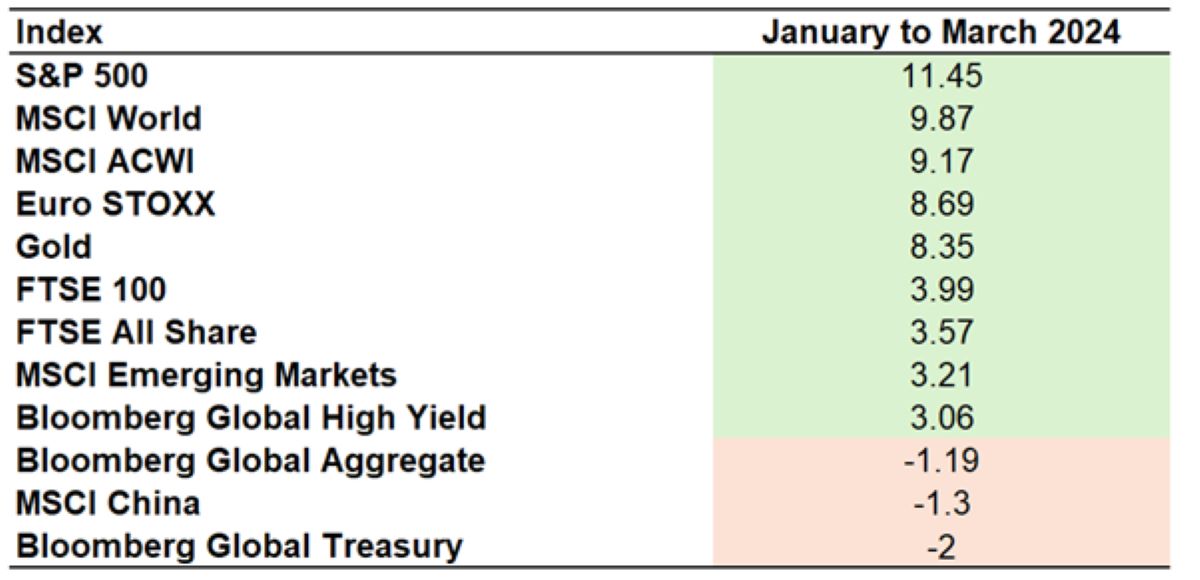
Figure 1 – Table of returns to key global asset classes – Source: FE Analytics, 2024.
US equities, in the form of the S&P 500 index, led the pack and drove global equity returns, represented by the MSCI World and ACWI indices. UK equities, in the form of the FTSE 100 and FTSE All Share indices, posted respectable performance, however lagged their European and US peers. Chinese equities were in the doldrums, pulled down by negative investor sentiment engendered by a deflating property bubble and the overhang of geopolitical tensions. In a few words: the US excelled, the UK did OK, and China saw serious underperformance.
April's Market Reaction
So what happened in April? US inflation and growth data disappointed investors relative to their expectations. Firstly, economic growth slowed, taking some initial wind out of the sails of US equities, but didn’t slow enough to force the Federal Reserve into signalling interest rate cuts. Secondly, US inflation remained more sticky than investors had hoped, with that last mile down to the 2% target being frustratingly elusive. The inability for inflation to make that final leap below 2% caused much consternation among investors, who removed between 1 and 2 expected interest rate cuts from their pricing of bond yields, causing bond yields to rise and subsequently equity prices to fall. US markets, in the main, drive global markets so this trend spread across most developed markets.
Interest Rate Expectations
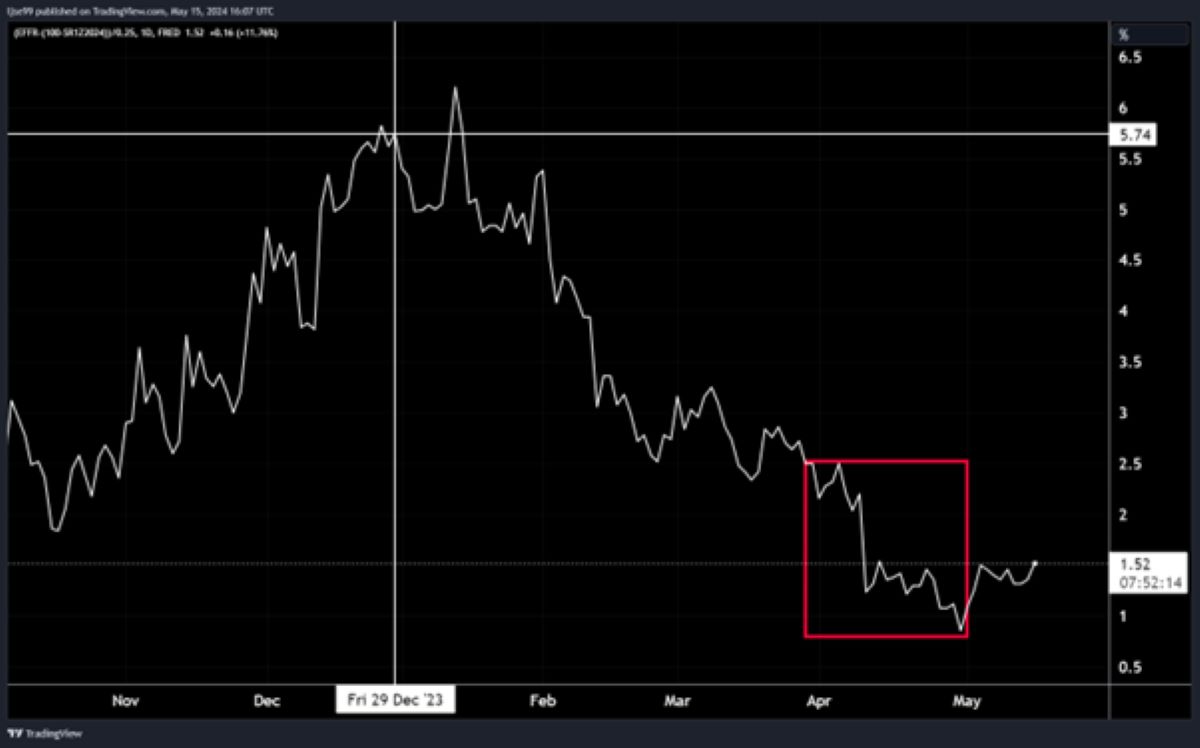
Figure 2 – Number of Federal Reserve interest rate cuts by the end of 2024 expected by markets – Source: TradingView, 2024.
The chart above illustrates the rollercoaster of interest rate expectations through the year. Markets expected nearly 6 interest rate cuts in 2024 at the start of 2024. By the beginning of April this was down to 2.5 cuts and by the end of April, following US GDP and inflation data, this was down further to only 1 interest rate cut. That final move has been boxed in red. This is a return of the so called ‘higher for longer’ interest rate narrative.
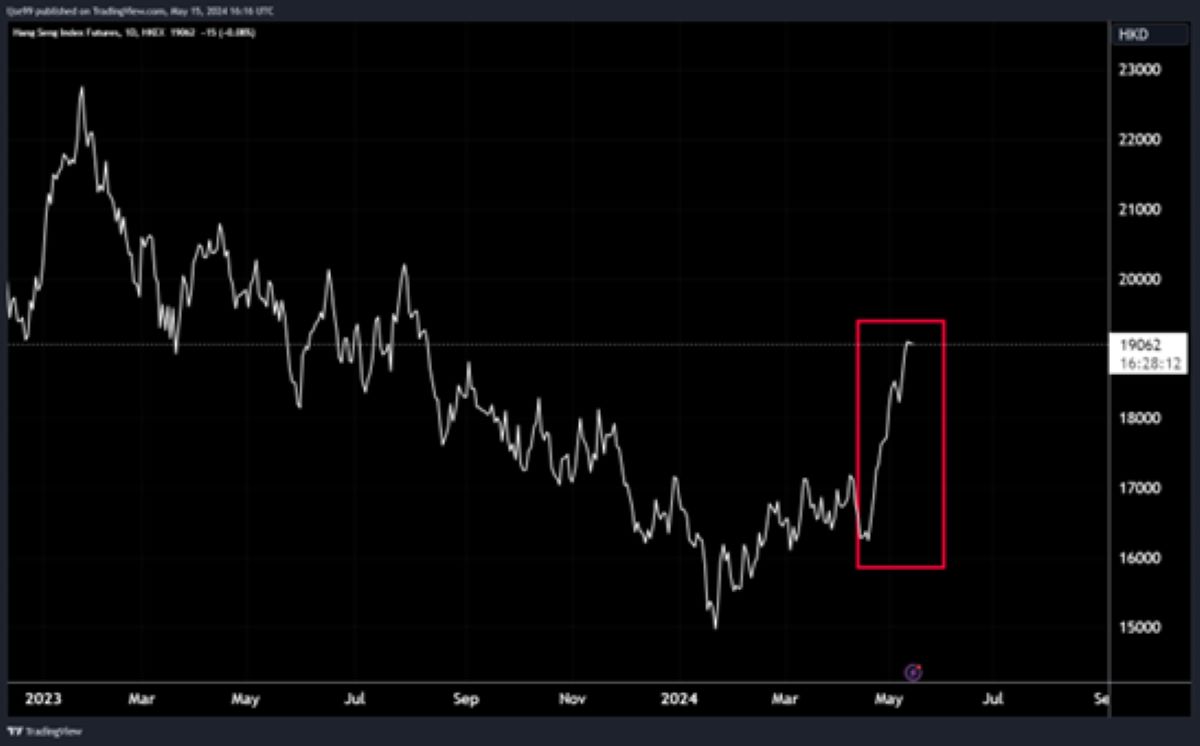
Figure 3 – Hang Seng equity index returns 2023 to date, with recent upwards thrust boxed in red – Source: TradingView, 2024.
However, all was not lost, especially for investors with a diversified portfolio. Chinese equities finally made their comeback, following a year of brutal drawdowns – Chinese authorities had engineered a small reversal in price slides through numerous measures (some as extreme as banning onshore fund managers from selling) and this initial price action drew in western investors who had sat on the side lines for the last year. As western investors returned, prices surged upwards , shown in the Figure 3.
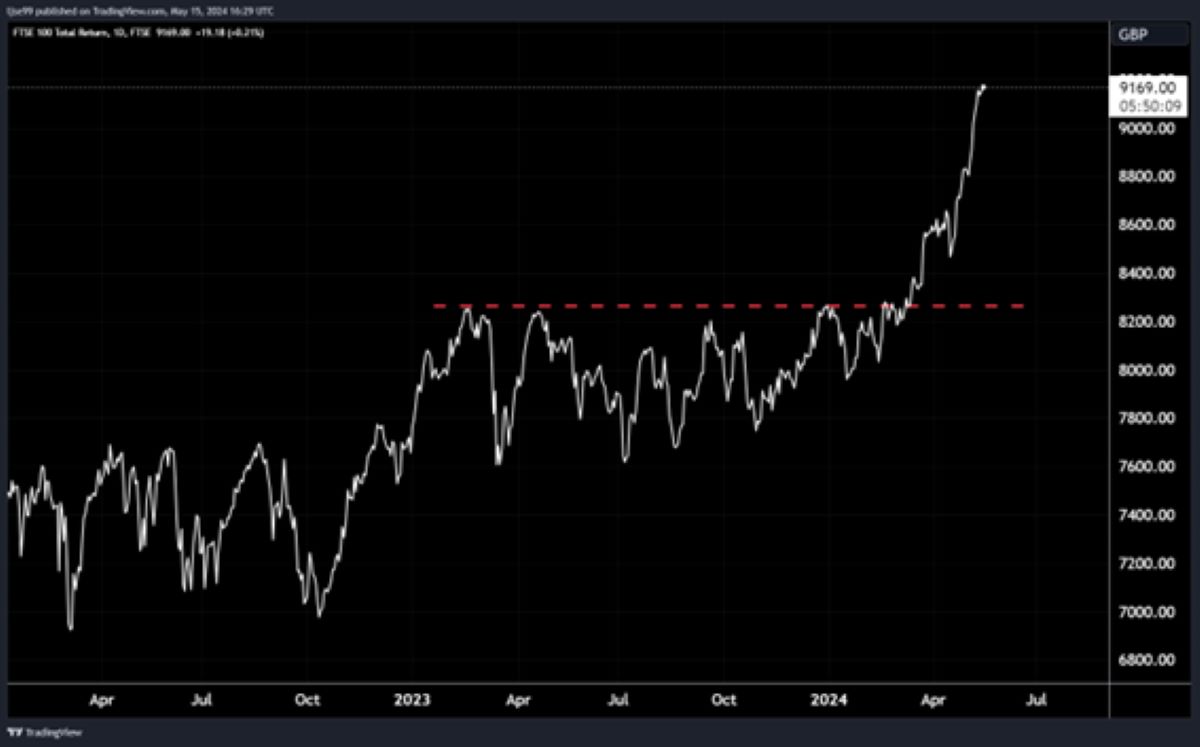
Figure 4 – FTSE 100 Total Returns – Source: TradingView, 2024.
Potentially more relevant to readers in the UK was the performance of UK markets, which broke out from the cage they had been trapped in for 2023 and the start of 2024. The UK has a very different sector composition to US markets: where the US is heavy on high growth technology stocks, the UK has more of the older world industries which have underperformed over the long run but are well suited to periods of rising interest rates and elevated commodity prices (which remain high due to geopolitical tensions).
| Sectoral Share FTSE100 | Pre-tax profit |
|---|---|
| Financials | 27% |
| Oil & Gas | 20% |
| Consumer Staples | 13% |
| Mining | 11% |
| Consumer Discretionary | 8% |
| Health Care | 8% |
| Industrial goods & services | 7% |
| Utilities | 3% |
| Telecoms | 2% |
| Real estate | 1% |
| Technology | 0% |
Figure 5 – Sectoral pre-tax profit share of the FTSE 100 – Source: Investor Chronicle, 2024.
The table in Figure 5 shows the sectoral share of FTSE 100 profits. Notable is the high share of financials (mainly banks) and energy and mining companies. Banks benefit from interest rates remaining higher for longer because it extends the period in which they can offer loans at high interest rates, increasing their margins and benefitting their profitability. Energy and mining companies benefitted from elevated commodity prices, which have seen an uplift as geopolitical tensions raise questions over security of supply.
Conclusion
In conclusion, markets at the highest level performed well from January to March, but took a tumble in April as slowing US economic growth and sticky US inflation caused investors to worry about the future path of interest rates – but this pain was not evenly spread, with some of the initial laggards becoming the best performers. This recent experience reinforces the need for a portfolio that is diversified across geographies, economic sectors and asset classes.
Investment Champion uses the expertise of the Investment Team at The Private Office to create simple to understand investment portfolios that offer an alternative and cost-effective way to make your money grow. The Investment Champion portfolios provide diversified investment exposure across a range of geographies and asset classes in order to produce attractive risk-adjusted returns for investors. These portfolios use passive funds which track the performance of a benchmark and are not actively managed by a fund manager. They therefore offer a cost-effective solution to building a portfolio.
This market update is for general information only, does not constitute individual advice and should not be used to inform financial decisions.
Past performance is not a guide to future returns. Investment returns are not guaranteed, and you may get back less than you originally invested.
![]()

