The investment crystal ball - What do we know so far?

With the first quarter of the year already wrapped up (it feels like Christmas was yesterday!) we thought it would be worth recapping the high-level macroeconomic picture and summarising the notable movements in markets through the quarter. We start with economic growth below.
Macroeconomics - Economic Growth & Inflation
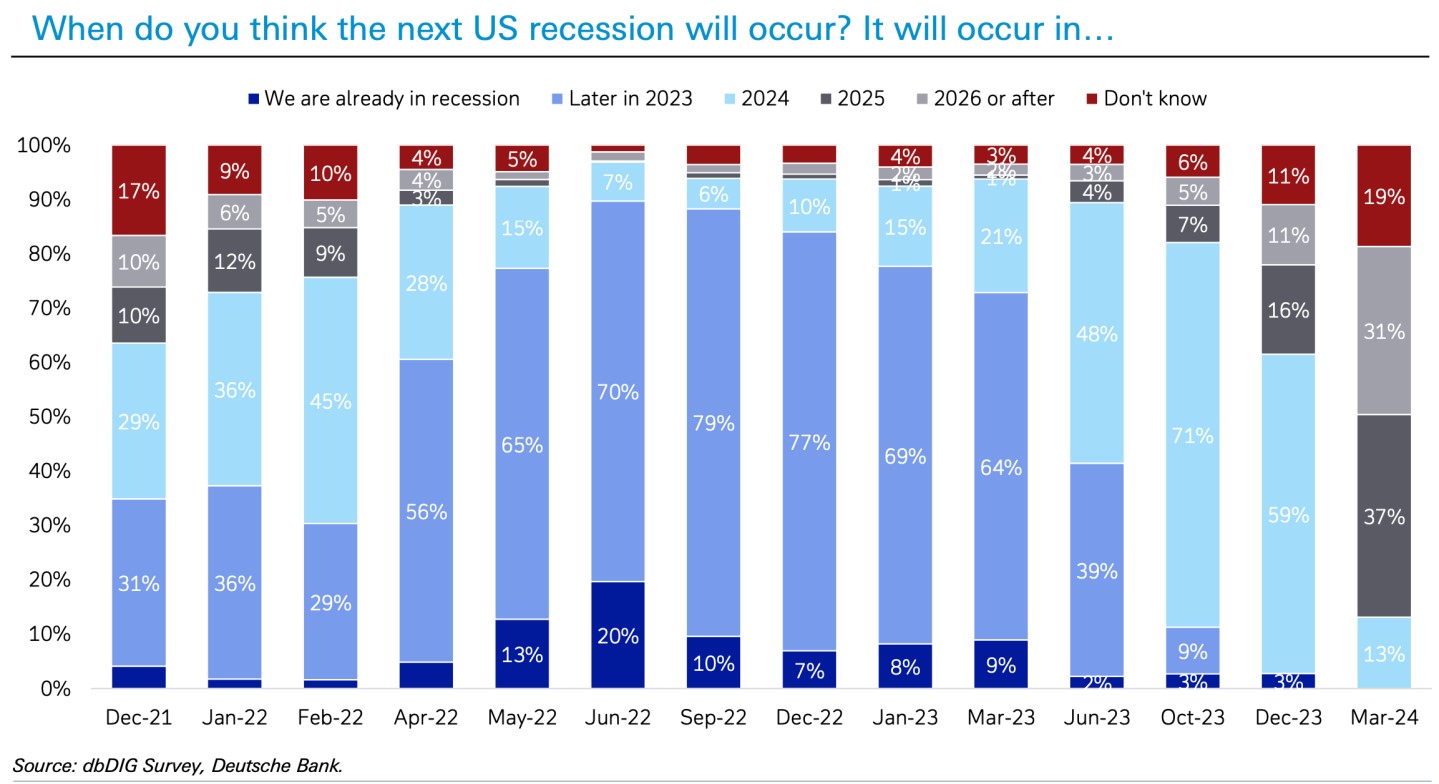
Before we dig into the current macroeconomic landscape it’s worth setting the scene by revisiting how macroeconomists expected the economy to perform both in 2023 and 2024’s first quarter. The chart above shows the percentages of economists that expect a US recession in given time periods, surveyed every quarter. Throughout 2023 the date of recession was pushed back ever further, from ‘later in the year’ out to ‘2024’. Now that we have arrived in 2024 expectations have moved out into 2025 and beyond. But why is this?
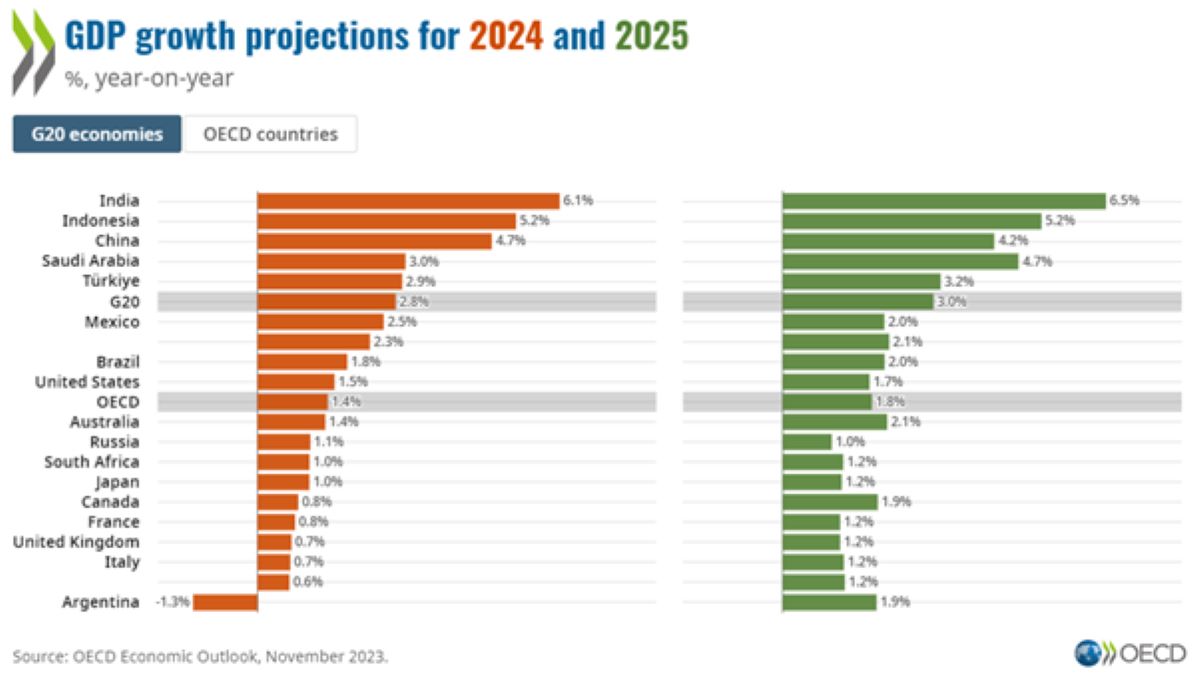
The most consequential data release was the Q4 2023 GDP data for the US, which surprised economists and investors, growing at an annualized rate of 3.4% . This has been reinforced by labour market data showing that hiring and wage growth remains strong, with the expectation that this will continue to support household consumption through 2024. The OECD now estimate the US economy to grow 1.5% in 2024, a far sight from the recession expected last year.
Economic growth outside of the US has been more sluggish, particularly in developed markets. Higher debt burdens in Europe have held governments back from the level of government investment seen in the US, while developed Asian economies are yet to see the full benefits of Chinese stimulus efforts. The OECD’s forecasts of economic growth in 2024 and 2025 for G20 economies can be seen below:
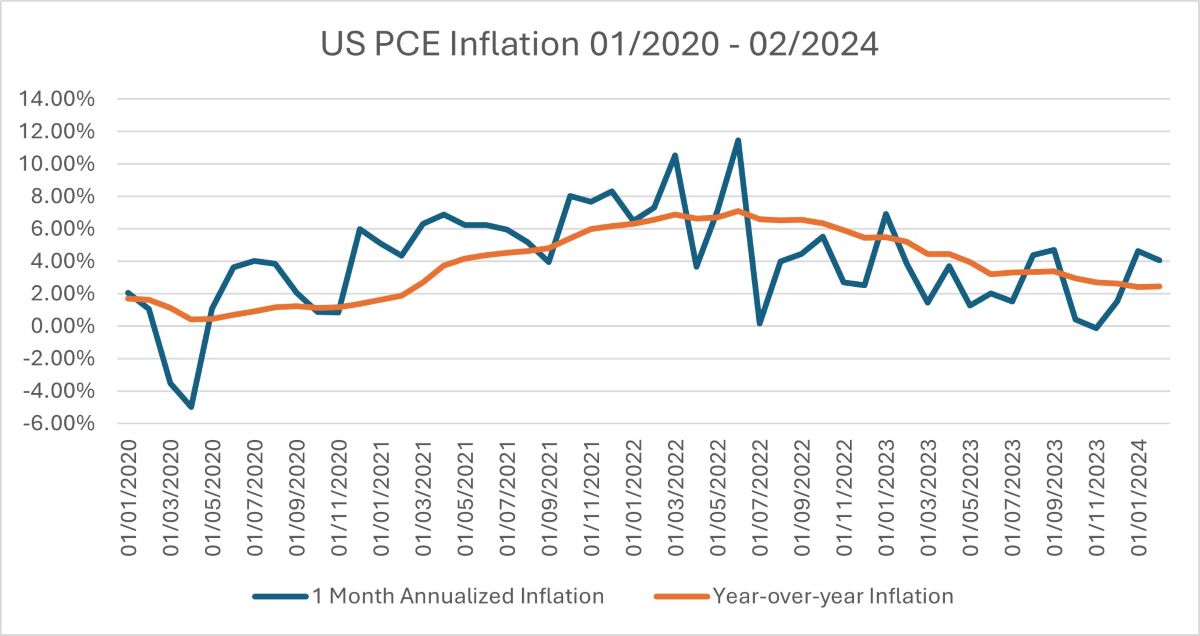
The chart above shows the US inflation rate from 2020 through to the latest data release for February 2024. The orange line shows year-on-year inflation, while the blue line shows the inflation in a given month at an annualised rate, i.e. showing what the inflation rate would be for a whole year if it stayed at the pace of that month. Inflation data is fairly volatile from month to month, so the year-on-year figures are important in establishing trends, while the monthly data is useful in spotting where those trends may be changing course.
Two things stand out in the graph. Firstly, there has been a clear downward trend in inflation since July of last year. This has supported the Federal Reserve in guiding markets towards interest rate cuts in 2024. Secondly, inflation in the first two months of this year has accelerated above the year-on-year rate, running at an annualised rate of 4-4.5%. This second point has caused consternation among investors, who are becoming less certain that central banks will be able to cut interest rates in the first half of this year.
Markets – Fixed Income
That final point leads into the market performance of fixed income securities.
The price of a bond is inverse to the yield it pays, meaning rising bond yields cause falling bond prices (and thus capital values) and vice versa. As interest rate cut expectations are pushed further into the future and become less probable, the yield on bonds rises. This effect, of changes in interest rates and their expected future path on bond prices is called ‘duration risk’, and the effects of this risk are greater when a bond’s maturity is longer and the coupon (yield) it pays is smaller. Government bonds tend to have longer maturities, and owing to their security, tend to pay a smaller coupon (yield), making them highly susceptible to changes in interest rate expectations. At the other end of the spectrum, you find high yield corporate bonds, which tend to have a short maturity, and owing to their lower credit quality (i.e. higher credit risk) they pay a higher coupon. Thus, government bonds are more exposed to duration risk, high yield corporate bonds are more exposed to credit risk, and investment grade corporate bonds tend to sit in the middle on both risks.
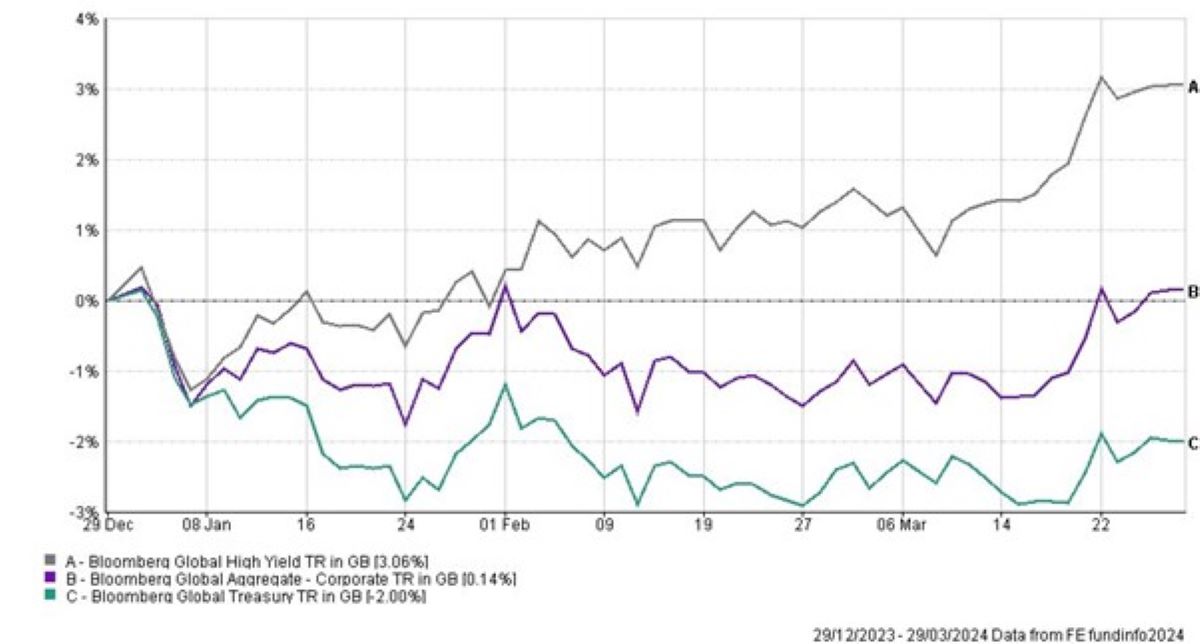
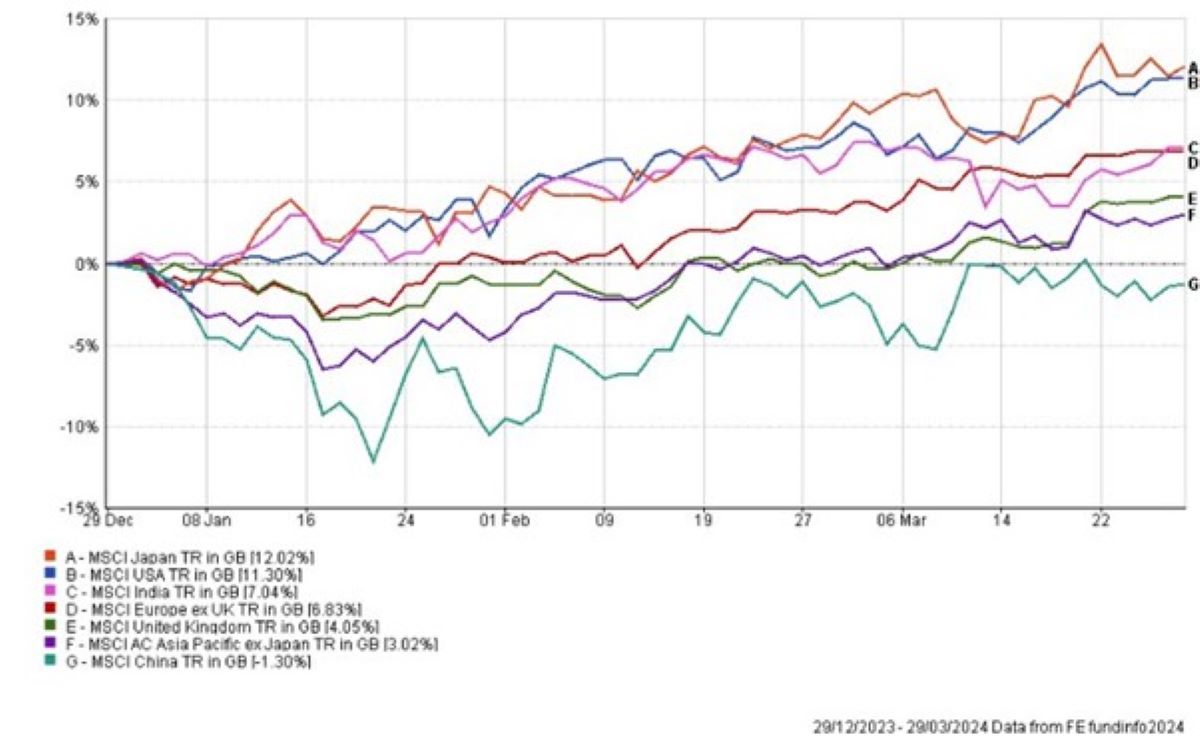
Equity markets shrugged off the losses in government bonds and posted a strong quarter, with China being the only major region to see losses – a deflating property sector continues to weigh on corporate investment and household consumption. The strongest performance on a country basis was seen in Japan, propelled by a combination of robust corporate profit growth and favourable international investor sentiment. An interesting picture emerges when equity returns are broken down by sector, shown below.
Leading contributors
Time period: 01/01/2024 to 31/03/2024
| Rescaled weight | Return | Contribution | |
| Semiconductors | 7.28 | 34.53 | 2.32 |
| Software | 10.03 | 9.83 | 0.96 |
| Banks | 7.08 | 9.89 | 0.70 |
| Interactive media | 4.81 | 14.64 | 0.70 |
| Retail - Cyclical | 5.31 | 12.46 | 0.65 |
| Insurance | 3.97 | 13.50 | 0.52 |
| Oil & Gas | 4.33 | 10.59 | 0.46 |
| Drug manufacturers | 5.01 | 8.87 | 0.44 |
| Industrial products | 2.47 | 10.94 | 0.27 |
| Aerospace & defense | 1.56 | 15.64 | 0.24 |
| Credit services | 1,74 | 11.59 | 0.20 |
| Medical devices & Instruments | 2.03 | 9.52 | 0.19 |
| Media - Diversified | 0.99 | 19.57 | 0.18 |
| Retail - Diversified | 1.57 | 10.97 | 0.17 |
| Farm & Heavy construction machinery | 0.74 | 16.96 | 0.12 |
Figure 6 – Sector level contributions to global equity returns in Q1 2024, Source: Morningstar Direct, 2024.
The table above show industries, their weightings in global equity markets, the returns generated by those industries in Q1, and by multiplying their weight and returns shows their contribution to global equity market performance.
AI and semiconductors have driven market performance through 2023 and the first quarter, shown by semiconductors and software ranking top two in sector contribution. What has been interesting is the catchup of many of the ‘cyclical’ sectors that are sensitive to changes in economic conditions, these are the likes of banks, oil and gas producers, discretionary retailers, and industrial product manufacturers. These sectors had been fairly flat for the first two months of the year but staged a comeback in March following the release of data suggesting an upturn in the global manufacturing cycle and inflationary pressures.
Summary
Economic growth has been better than expected so far this year, particularly in the US.
Strong growth has underpinned rising inflation, which has held back government bond performance but supported returns in high yield corporate bonds.
Equity markets have been largely unphased by recent inflation data, with semiconductor and AI related stocks continuing to gain. However, towards the end of the quarter there has been a notable rotation into cyclical stocks that benefit from an economy that is heating up, both in terms of inflation and manufacturing growth.
As a client of either our discretionary or advisory portfolio service, your portfolios are positioned to capture remaining upside in the AI/semiconductor space, while retaining significant allocations to cyclical sectors through UK & European equities. Similarly, we remain vigilant to developments in bond (fixed interest) markets. Our asset class and sector/industry diversification aims to smooth out returns and ensure that our investors benefit from different investment opportunities throughout the economic cycle.
Investment Champion uses the expertise of the Investment Team at The Private Office to create simple to understand investment portfolios that offer an alternative and cost-effective way to make your money grow. The Investment Champion portfolios provide diversified investment exposure across a range of geographies and asset classes in order to produce attractive risk-adjusted returns for investors. These portfolios use passive funds which track the performance of a benchmark and are not actively managed by a fund manager. They therefore offer a cost-effective solution to building a portfolio.
This market update is for general information only, does not constitute individual advice and should not be used to inform financial decisions.
Past performance is not a guide to future returns. Investment returns are not guaranteed, and you may get back less than you originally invested.
- Terms & Conditions
- Privacy Policy
- Key Investor Information
- Complaints
- About us
- Our fees
- FAQs
- Contact us
- Sitemap
- The Private Office
- Savings Champion
As with all investing, your money is at risk. The value of your investments can go down as well as up and you could get back less than you put in. Read more information about risk here. The tax treatment of your investment will depend on your individual circumstances and may change in the future. You should seek financial advice if you are unsure about investing.
Investment Champion Online Limited is an Appointed Representative of The Private Office Limited, which is authorised and regulated by the FCA. Both companies are registered in England and Wales with a registered office at 2 The Bourse, Leeds LS1 5DE. Dealing and custody services are provided by Hubwise Securities Limited which is authorised and regulated by the Financial Conduct Authority FRN: 502619.
Copyright