Is the inflation yo-yo and US big-tech distorting investment returns?

As 2024 has started, two key themes have been driving markets. The first is the change in market expectations of the future path of interest rates and the second is the results of the most recent US corporate earnings season. The reason we focus on the US corporate earnings season is the dominance of US markets, which are around 60-70% of the global equity market by market capitalisation.
Interest Rate Expectations
In the fourth quarter of 2023, following a string of monthly inflation data releases that pointed to Central Banks, particularly the US Federal Reserve, imminently achieving their goal of 2% inflation, there was a sharp move in market expectations of interest rate policy. Markets started to expect interest rate cuts to begin in March and continue through the year, culminating in 7 interest rate cuts. Fast forward to the Federal Reserve’s January press conference where Chairman Powell told the press “I don’t think it’s likely that the committee will reach a level of confidence by the time of the March meeting to identify March is the time to [cut interest rates]”. This language had immediate effect – where markets had expected a 62% probability of a March rate cut before the speech, afterwards markets only assigned an 18% probability. This view was further reinforced by the release of labour market data that points to continued strength in employment, along with the release of December’s US inflation data in which inflation ticked up marginally.
In the UK the picture has been a little more complicated, as markets came into the year far more uncertain over the path of inflation and economic growth in the UK. This is important because Bank of England interest rate policy is set based on minimising inflation and maximising growth, so uncertainty over future inflation and growth makes central bank policy less easily predicted by markets.
Taking inflation first, the UK like the rest of the world has benefitted from the reopening of supply chains and falls in commodity prices previously inflated by Russia’s invasion of Ukraine. Domestically though, inflationary pressures remain high, primarily through high wage growth sustained by a mismatch between the type of job vacancies and the skills of available applicants.
With economic growth, the conundrum is between the ‘hard data’, typically collected by governmental agencies and based on activity that has already happened, like economic growth, and the ‘soft data’, typically survey based and forward looking. The Office for National Statistics (ONS) hard data shows the UK entering a mild recession in 2023 along with sharply declining retail sales in December, however the soft data, such as S&P Global’s Purchasing Managers Index point to UK GDP growth moving up % in 2024 (to an annualised rate of 1-1.5%). Taken together, this had made it difficult for investors to predict how the Bank of England will implement policy through 2024. Fortunately for investors, a great deal of certainty has been gained upon the release of January’s inflation data – prices fell -0.6% from December ‘23 to January ’24, taking the annual figure from January ’23 to January ’24 to 4%. It now appears much more likely that the Bank of England will be able to cut interest rates in the near future given that the inflationary threat appears weaker.
Earnings Season
This US earnings season has been a bit of a rollercoaster, starting off weak and rapidly strengthening, leading market sentiment to become increasingly optimistic. Earnings season starts in mid-January with banks and financial firms, who made a poor start and put a negative framing on the season. Following weak earnings releases by cyclical sectors such as energy and basic raw materials these expectations continued. In late January and early February there was a sharp move upwards in aggregate earnings estimates, as the large tech firms (including the so called ‘Magnificent 7’) that comprise 30% of the S&P 500 reported earnings growth far outstripping other sectors. This resulted in an S&P 500 wide earnings growth rate of 2.9%. Conventions over sector can be a little confusing – Amazon and Tesla are classed as Consumer Discretionary businesses, Meta is classed as Communications Services, while Nvidia, Google and Microsoft are in the expected Information Technology sector. This results in the following sectoral earnings growth:
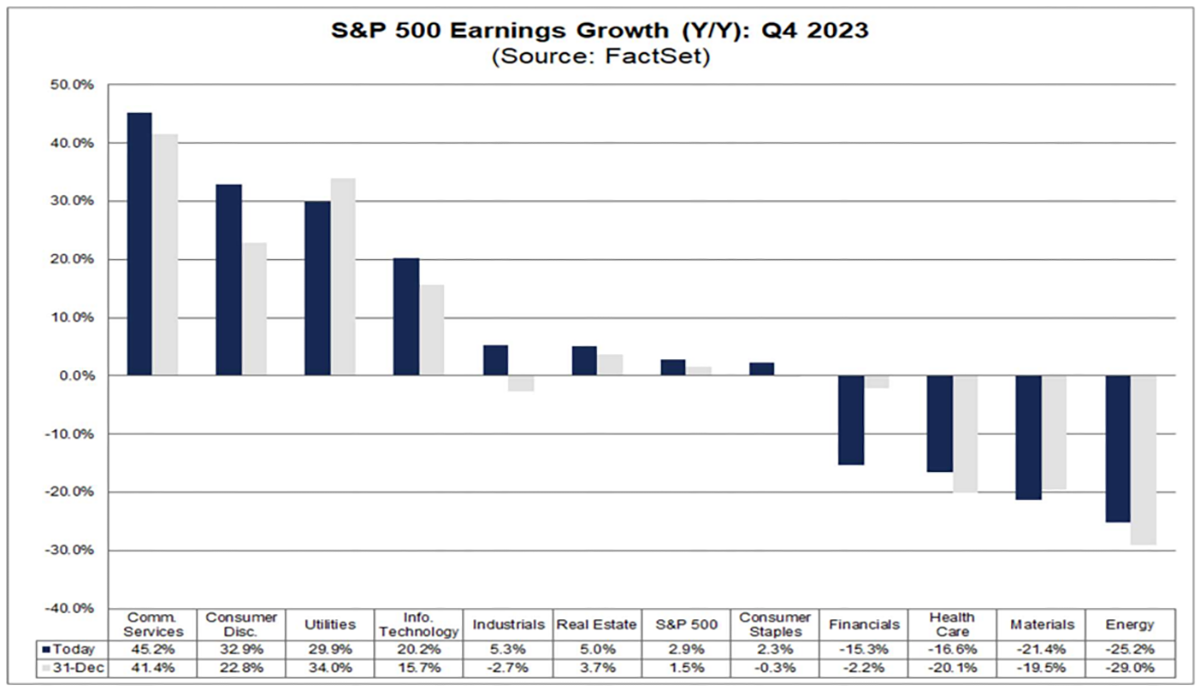
Figure 1 – Sectoral S&P 500 Earnings Growth, Source: FactSet 2024
This will be important when we look at equity market returns by sector.
A quick note on the international picture – European earnings declined at an aggregate level in Q4, US earnings grew 2.9%, while Japanese earnings grew even more rapidly.
Market Reactions
So, how have markets reacted to changes in interest rate expectations and the most recent US corporate earnings season?
Starting with the former, the asset class that had seen the swiftest price gains in November and December was small-cap equities. Small-cap equities have a high sensitivity to interest rate expectations for two reasons, firstly they tend to be more financially fragile and reliant on borrowing at prevailing interest rates, secondly their value often derives from their growth of cashflows far in the future, which is sensitive to interest rates. The result is that small-caps outpaced the wider market as interest rate expectations fell at the end of 2023, but have lagged at the start of this year as interest rate expectations have risen. Government bonds are also sensitive to interest rate expectations, and have seen a similar return profile. Figure 2 below shows the S&P 500 large cap index, MSCI USA Small Cap index and the Bloomberg US Government Bond index over November and December 2023, while the Figure 3 shows those same instruments year-to-date.
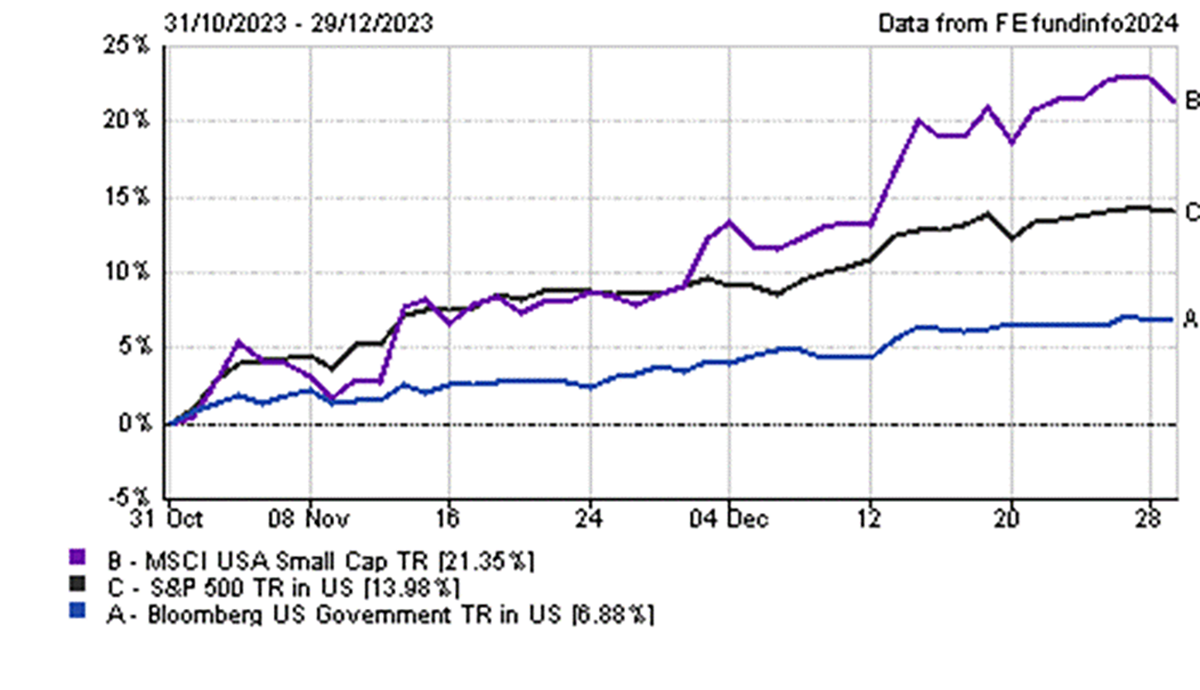
Figure 2 – US Small Cap Equity, US Large Cap Equity & US Treasury Bond returns in November and December 2023, Source: FE Analytics 2024.
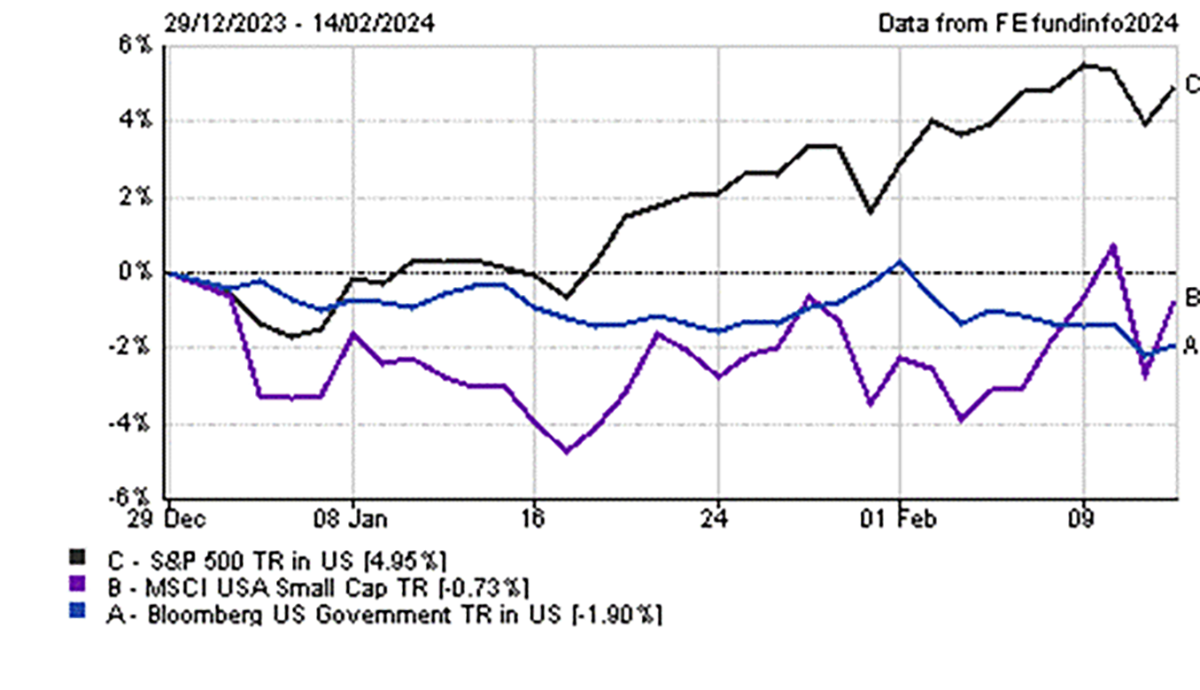
Figure 3 – US Small Cap Equity, US Large Cap Equity & US Treasury Bond returns year-to-date, Source: FE Analytics 2024
Now, moving to the effects of the most recent corporate earnings season. The big-tech sectors were the leaders this earnings season, while the cyclical energy and Materials sectors were the laggards. These results have translated through to equity market returns, and have resulted in the big tech names leading the stock market upwards:
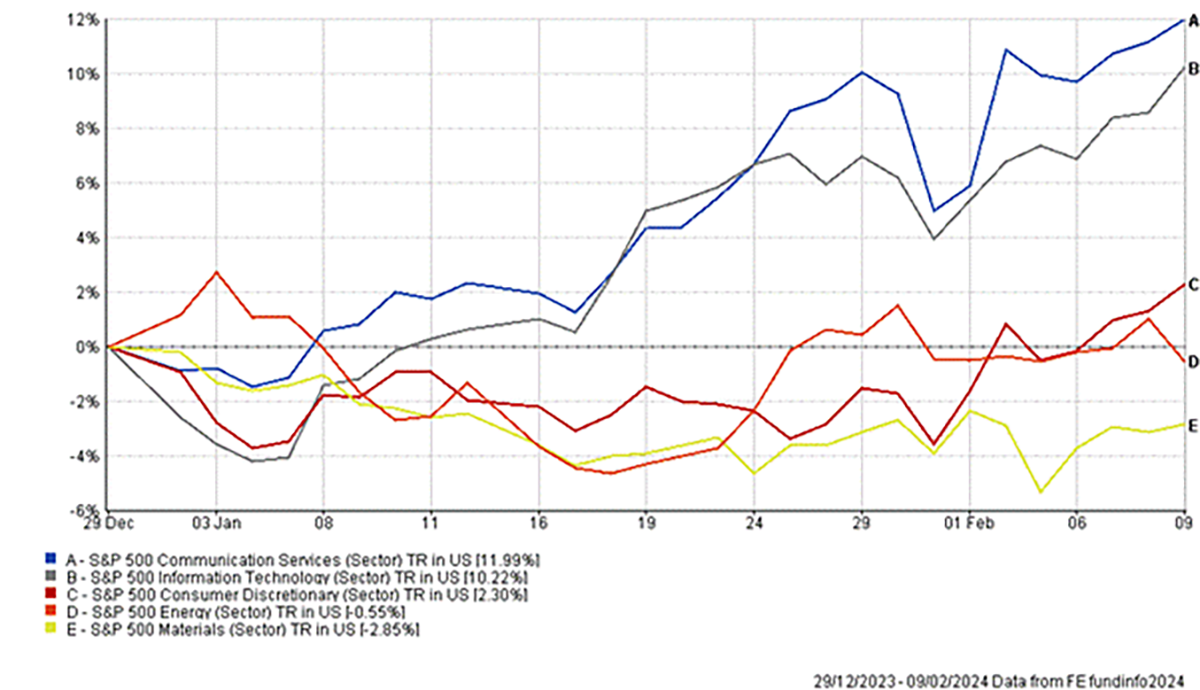
Figure 4 – US Sectoral equity returns year-to-date, Source: FE Analytics 2024.
Similarly, when comparing regional equity markets, Japanese equities have outperformed US equities, which have outperformed European equities. This follows the pattern of regional earnings growth.
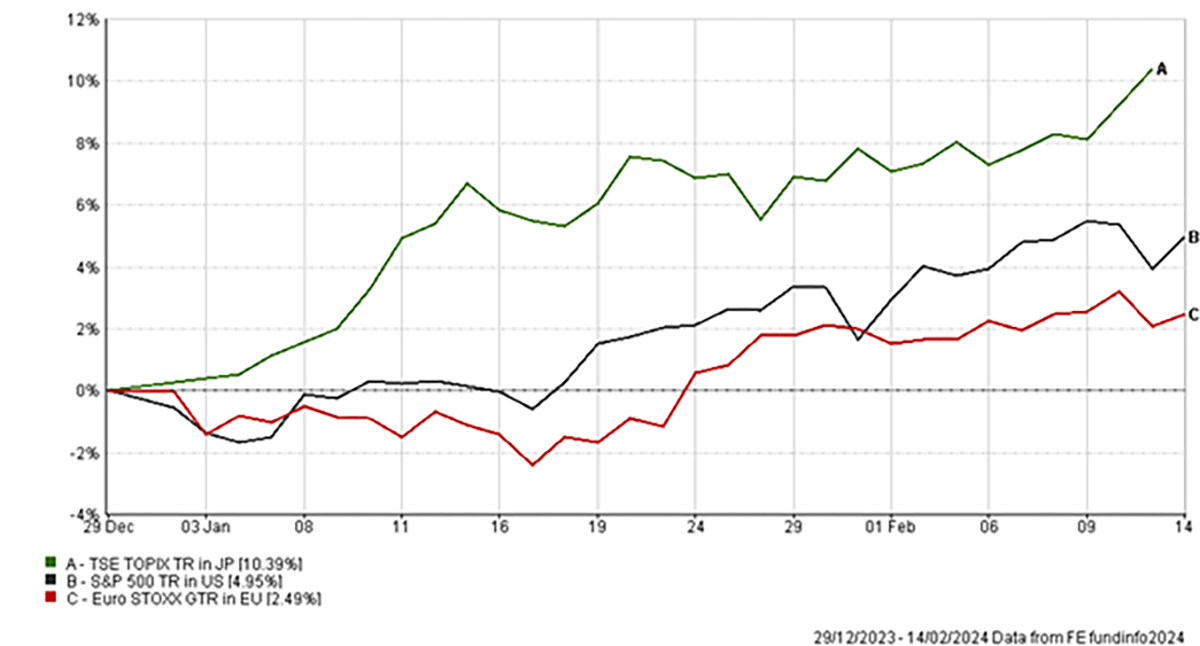
Figure 5 – Regional equity returns, Source: FE Analytics 2024.
Conclusion
In summary, we came into 2024 with expectations of imminent interest rate cuts, which had driven strong performance in interest rate sensitive assets like small-cap equities and government bonds, however the tempering of these expectations has caused a reversal in these returns. Equity markets have broadly followed the pattern of corporate earnings, inter-regionally this has played out through stronger market returns to regions with stronger earnings growth, and intra-regionally has played out through stronger market returns to sectors with stronger earnings growth.
The pattern of returns described above has been beneficial to our discretionary portfolios, which have an agile asset allocation and have been able to skilfully surf the US tech wave by maintaining an overweight position to these winning names. The discretionary nature of these portfolios also means that exposures can be rapidly changed if the investment thesis changes. Although the asset allocation of our advisory services is, by design, not as nimble, we have positioned them to take advantage of the structural themes that have played out in this most recent corporate earnings season, by adding a structural overweight position to Japanese equities, where we have identified the potential for long-term earnings growth outperformance.
Investment Champion uses the expertise of the Investment Team at The Private Office to create simple to understand investment portfolios that offer an alternative and cost-effective way to make your money grow. The Investment Champion portfolios provide diversified investment exposure across a range of geographies and asset classes in order to produce attractive risk-adjusted returns for investors. These portfolios use passive funds which track the performance of a benchmark and are not actively managed by a fund manager. They therefore offer a cost-effective solution to building a portfolio.
This market update is for general information only, does not constitute individual advice and should not be used to inform financial decisions.
Past performance is not a guide to future returns. Investment returns are not guaranteed, and you may get back less than you originally invested.
- Terms & Conditions
- Privacy Policy
- Key Investor Information
- Complaints
- About us
- Our fees
- FAQs
- Contact us
- Sitemap
- The Private Office
- Savings Champion
As with all investing, your money is at risk. The value of your investments can go down as well as up and you could get back less than you put in. Read more information about risk here. The tax treatment of your investment will depend on your individual circumstances and may change in the future. You should seek financial advice if you are unsure about investing.
Investment Champion Online Limited is an Appointed Representative of The Private Office Limited, which is authorised and regulated by the FCA. Both companies are registered in England and Wales with a registered office at 2 The Bourse, Leeds LS1 5DE. Dealing and custody services are provided by Hubwise Securities Limited which is authorised and regulated by the Financial Conduct Authority FRN: 502619.
Copyright