Will 2023 see a calming to the storm?

In 2022 rising inflation and interest rates were bad for government bonds and equities. In 2023 inflation will come down and interest rates should peak - will it be a better year for markets?
2022 was a difficult year across asset classes and geographies, with few escaping the pressures caused by inflation, rising interest rates, and commodity shortages. While this was a painful period for those already holding investment assets, it created a far more attractive valuation landscape for those looking to invest now and sows the seeds for strong returns going forward.
It’s hard to state how broad-based the declines in asset valuations were in 2022, with very few places to hide. High inflation caused bond market participants to assume central banks would tighten policy significantly, which they ultimately did, and so government bonds were sold off such that yields reflected this monetary tightening by rising significantly (bond yields rise when bonds fall in value). Rising bond yields hit equity returns in two ways: firstly, it increased the return available to investors without taking equity levels of risk, secondly it increased the discount rate by which future cash flows are discounted back to the present. The former means that investors will require a greater earnings yield (Earnings Per Share/Price Per Share) to compensate for the risk of owning equities and so will demand a lower equity price. The latter means that investors will find the fundamental present value of a company to be lower and so will demand a lower equity price. The outcome of this dynamic is shown in the following graph showing returns for bonds and equities from 1871 to 2022. As you can see, 2022 was a very tough and unusual year.
Return of bonds and equities 1871-2022
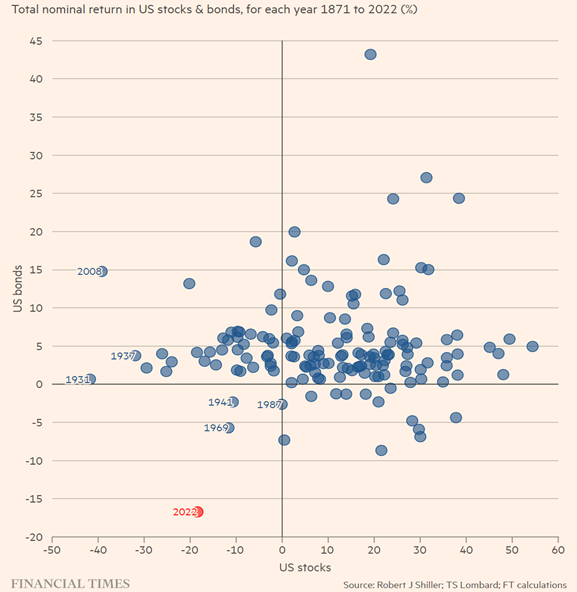
Figure 1. (Source: FT – December 2022)
Investment Association Sector Performance by proportion providing positive returns
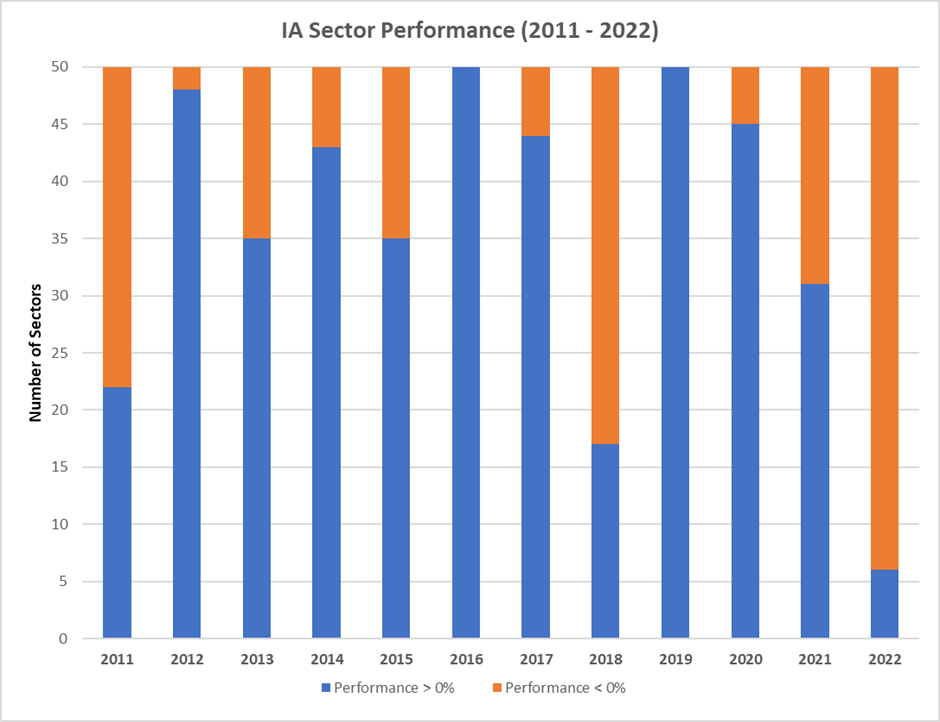
Figure 2. (Source: FE - January 2023)
The graph above shows the proportion of Investment Association sectors (e.g. IA Latin America Equity, IA Europe Ex-UK Bonds, IA North America Equity, etc.) that achieved a positive return in a given year. 2022 ranks as the worst of the previous 12, with only six sectors (out of the 50 reported) posting positive returns.
Brazil, and Latin America more widely, was a beacon of light in a sea of darkness and this performance firmly reflects two of the big themes of 2022. Firstly, monetary responses to inflation, where Brazilian policymakers took far more timely efforts to raise interest rates to tame inflation – these higher interest rates and softer inflation figures pulled capital in. Secondly, commodity shortages, where Brazil is a heavy hitter – Brazil is a large producer of both energy and agricultural goods, both of which were heavily impacted by the Russia-Ukraine war.
IA Sector returns for 2022
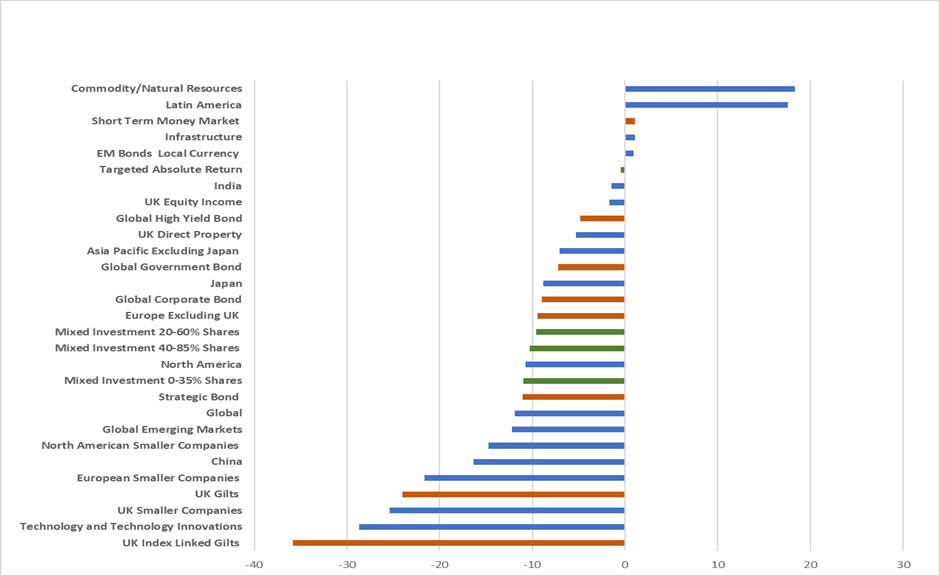
Figure 3. (Source: FE - January 2023)
With 2022 behind us, we can now look ahead to 2023. We will start with the economic picture, which isn’t rosy, and then move to the outlook for assets, which is more encouraging.
Our economic base case for 2023 is as follows:
- Growth – low, with recession in the developed world.
- Inflation – falling but above the 2% target in most countries.
- Interest rates – remaining elevated but likely to have peaked.
That the US will enter a recession in 2023 is not a niche view, with the majority of economic models and forecasting tools pointing to this outcome. The Conference Board Recession Probability Model has an impressive track record and the most recent output of the model is shown below.
US Recession Probability Model
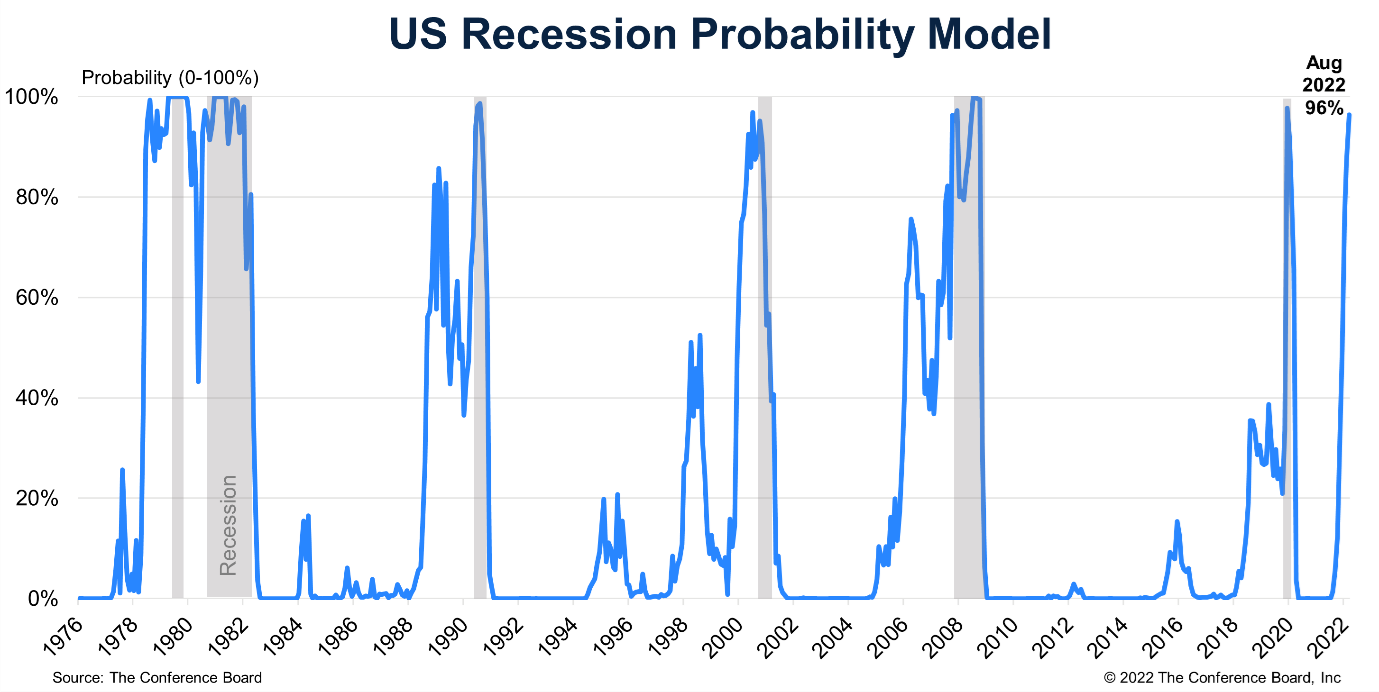
Figure 4. (Source: The Conference Board - December 2022)
GDP forecasts
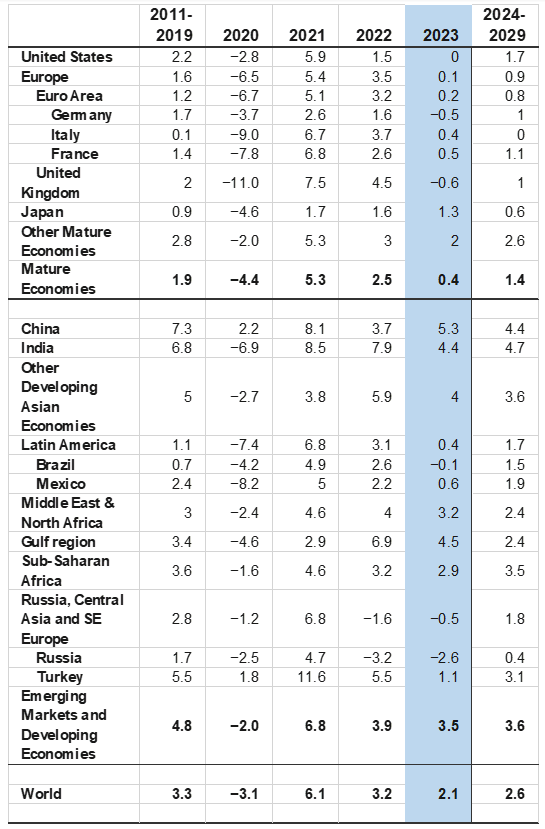
Figure 5. (Source: Conference Board - December 2022)
Zooming out from the US and looking across the globe, a divergence appears between developed and emerging economies, for example, it is anticipated that emerging economies outperform developed markets and for the most part escape recession. A key driver of that divergence is the fact that China and the US are operating on counterbalancing economic cycles – as the US is entering recession China is reopening and stimulating its economy. Many emerging market economies are deeply intertwined with China’s, as China is the world’s largest commodity importer and emerging economies tend to have a tilt toward commodities, this means that their economies move more in line with China’s than with the US.
We will now zoom back into the world’s largest and most important asset market: the US. As stated previously, the US is highly likely to enter a recession and this in turn is expected to substantially pull inflation down. Using the ‘core’ inflation figures (which strip out volatile food and fuel prices), the Federal Reserve forecast inflation to fall to 3.5% in 2023. While this represents a significant cooling from the figures seen in 2022, it is still well above the 2% target and so will continue to require monetary tightening.
Federal Funds Futures
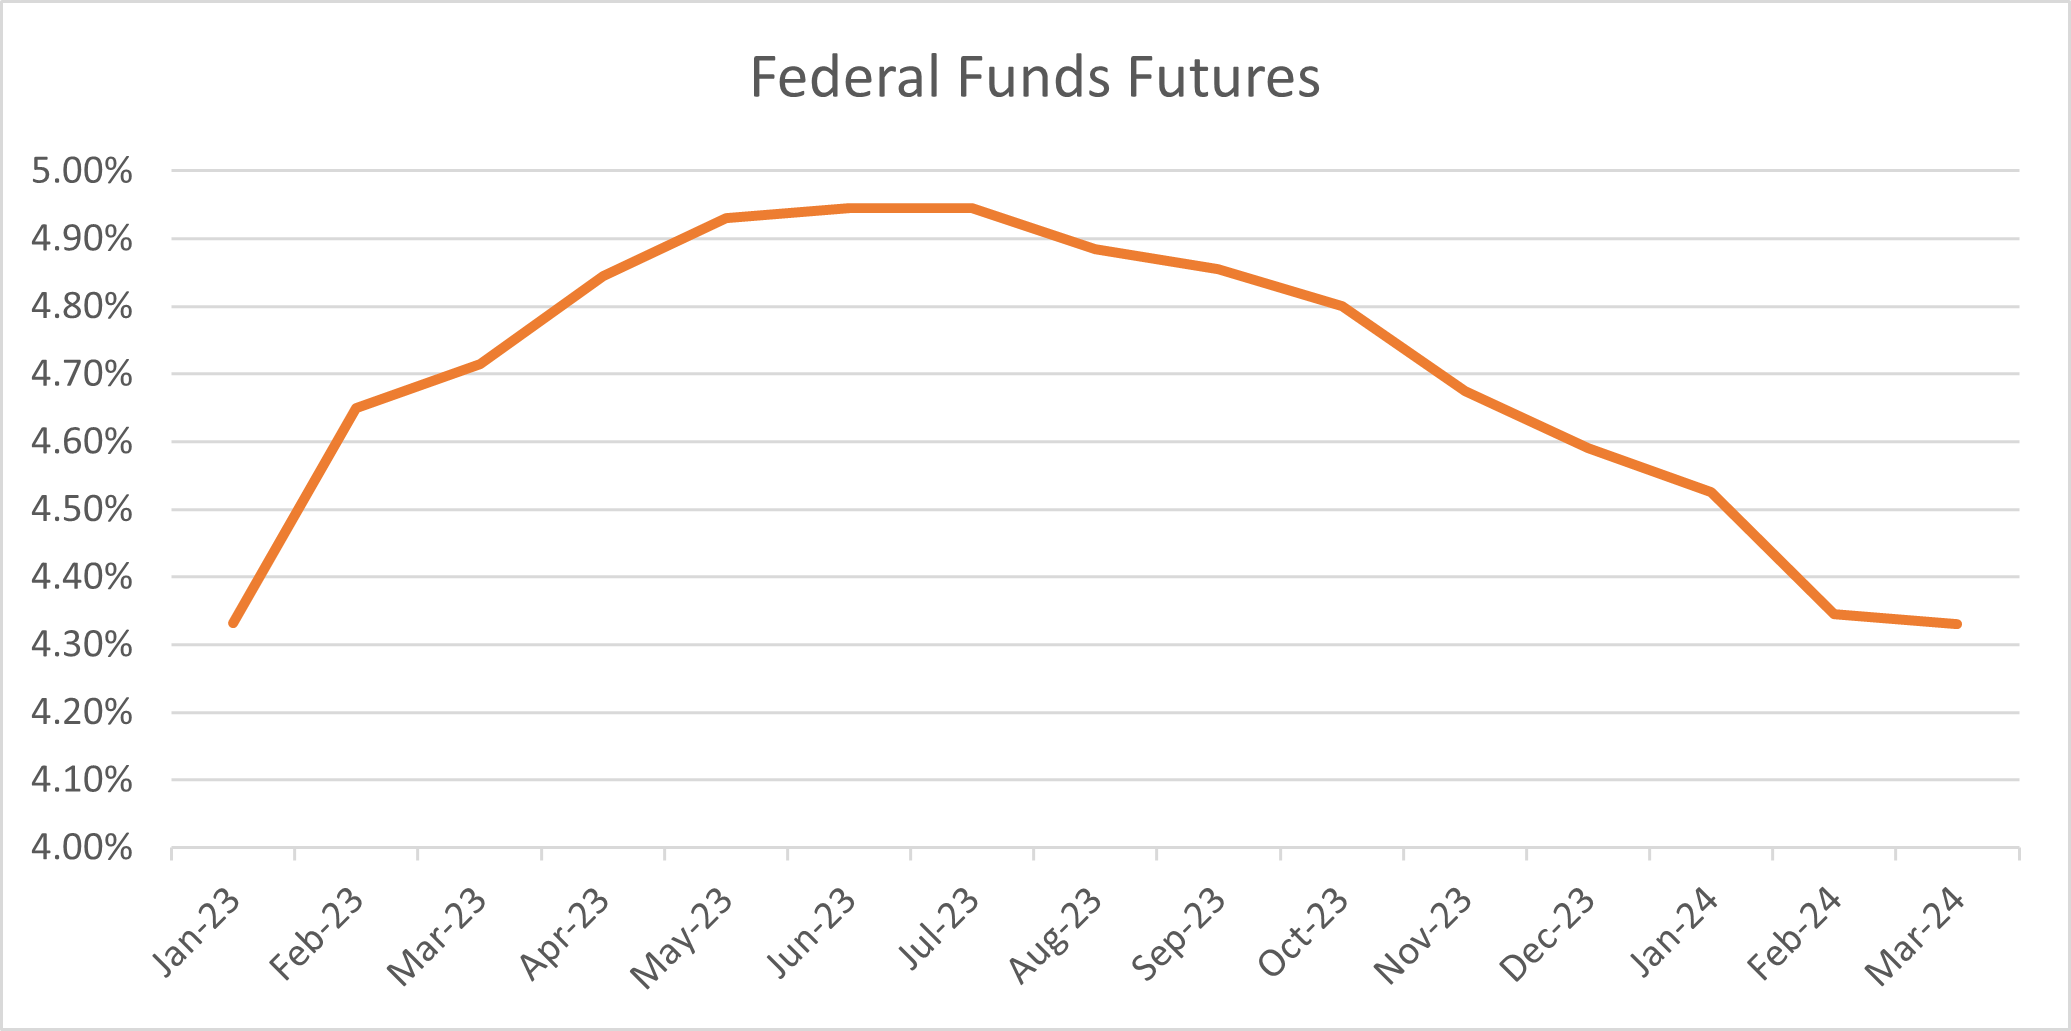
Figure 6. (Source: CME Group - January 2023)
To that end, the graph above shows market participants' expectations of the Federal Funds rate (the short-term interest rate set by the Federal Reserve). Market participants expect the Fed to continue tightening monetary policy by raising rates until around July, when it is expected the Fed will start to loosen policy in reaction to a slowing economy.
Now that we have an idea of where the economy is heading in 2023, let’s look at the outlook for financial assets. Starting with government bonds, where the pain of 2022 has left real value on the table for investors able to stomach the risk.
Bond yields can be seen in nominal terms, or in inflation-adjusted ‘real’ terms – to get the ‘real’ yield you subtract the expected inflation over the term of the bond from the nominal yield.
Real Yields and Expected Inflation
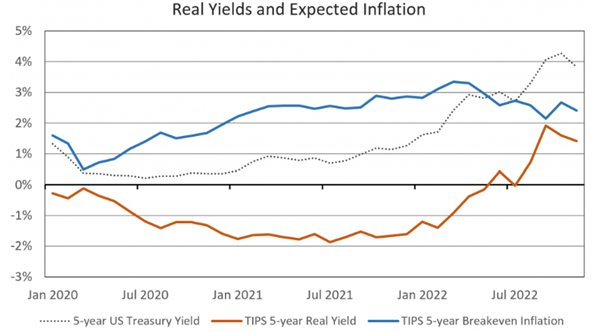
Figure 7. (Source: Neuberger Berman - December 2022)
The graph above shows the US 5-year bond yield in a grey dotted line, 5-year inflation expectations in blue, and the ‘real’ yield in orange. Real yields have been negative for some time, so a positive real yield represents a significant value.
Moving to equities, there is a similar dynamic whereby the financial wildfires of 2022 have cleared space for new growth in 2023. While earnings (corporate profits) are expected to fall in line with economic growth in 2023 due to the sharp declines in equity prices, valuations are still lower than when we entered 2022. Given these lower valuations, we can expect a similar outcome to previous recessions, in which equities see significant growth. The following graph shows average US equity returns after US recessions and should give equity investors some cause for hope going forward.
Average returns after a recession
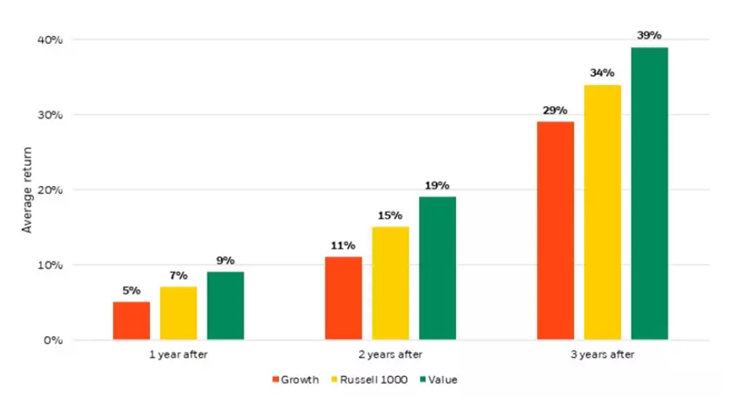
Figure 8. (Blackrock Outlook - December 2022)
In summary, it was a torrid period for markets last year, but the outlook for this year looks more favourable. A material decline in asset prices creates attractive opportunities and the risks that investors faced last year show signs of abating with interest rates expected to peak and inflation rates expected to fall.
Volatility is expected to remain elevated in markets as investors contend with the prospect of a recession, however, in these times it’s important to remember that the economy is not the market, and the market is not the economy.
History shows that investors holding their nerve during tumultuous periods in markets have been rewarded by achieving their long-term goals.

![]()

